Introduction to risk modeling with Bayesian networks
What is risk management?
Risk management involves the identification, analysis and prioritization of risks, in conjunction with efforts to minimize, monitor and control the likelihood of unwanted events occurring and control their impact, for example through process improvement, the use of technology, or better financial planning.
As well as avoiding loss, risk models are also used to maximize the chance of realizing opportunities.
Types of risk
We will not cover the full range of risks that companies model, however it is interesting to note that it is not uncommon for sophisticated financial institutions to model between 50-100 different types of risks.
- Credit Risk (also known as Default Risk)
- CounterParty Risk
- Market Risk (also known as systematic risk)
- Political Risk
- Country Risk
- Foreign Exchange Risk
- Inflationary Risk
- Health and safety risks
- Reputation risk
- ... and many more
Risks typically fall into one of two categories; those that are fully or partially under our control and those that aren't. However both types of risk can potentially be mitigated.
Prevention and cure
Controls (mediation) can limit the negative impact (or protect the upside) of risks. Controls that are put in place before events occur are called 'Proactive' or 'Preventative' whereas those that limit the loss (or protect the reward) are called 'Reactive' controls.
Traditional approaches to risk
There are many different approaches to risk management. They broadly fall into two categories.
- Qualitative - methods which do not use a model. Even though they may have a priority, the risks are not combined in any sophisticated way.
- Quantitative - a model is used, allowing for more sophisticated analyses.
Risk registers
Many companies still take a simplistic approach to risk management. Essentially they maintain a list, which is not much more sophisticated than a shopping list.
Each item in the list typically contains the following information:
- Risk name/identifier
- Priority
- Mitigation
Some organizations maintain two similar lists, one for risks, and another for issues, for when the risks materialize.
A common problem, that is not exclusive to this approach, is that if someone has added a risk to the list, the perception is often that the risk is therefore somehow taken care of, regardless of whether concrete steps have been taken to mitigate the risk. Unfortunately this can lead to 'I told you so' or 'well I added it to the risk register'.
Bow-tie models
Bow-tie models are more sophisticated than risk registers, in that they attempt to crudely model the causes and effects in layers.
Some organizations use bow-tie models without quantifying the effect that each cause has on each effect, however some take the next step by trying to quantify the relationship between threats, risks, consequences, etc....
Unfortunately, many approaches used to add quantitative features to bow-tie models, do not constitute a unifying framework. Most lack some if not all desirable features, such as the ability to reason forwards and backwards, handling of non-monotonic logic, support for missing data, and the various analysis tools that we discuss later.
A unifying framework
Bayesian networks provide a unifying framework for risk management. There are a number of related and theoretically sound components to this unifying framework:
- Probability
- Utilities (Optional), e.g. rewards, costs
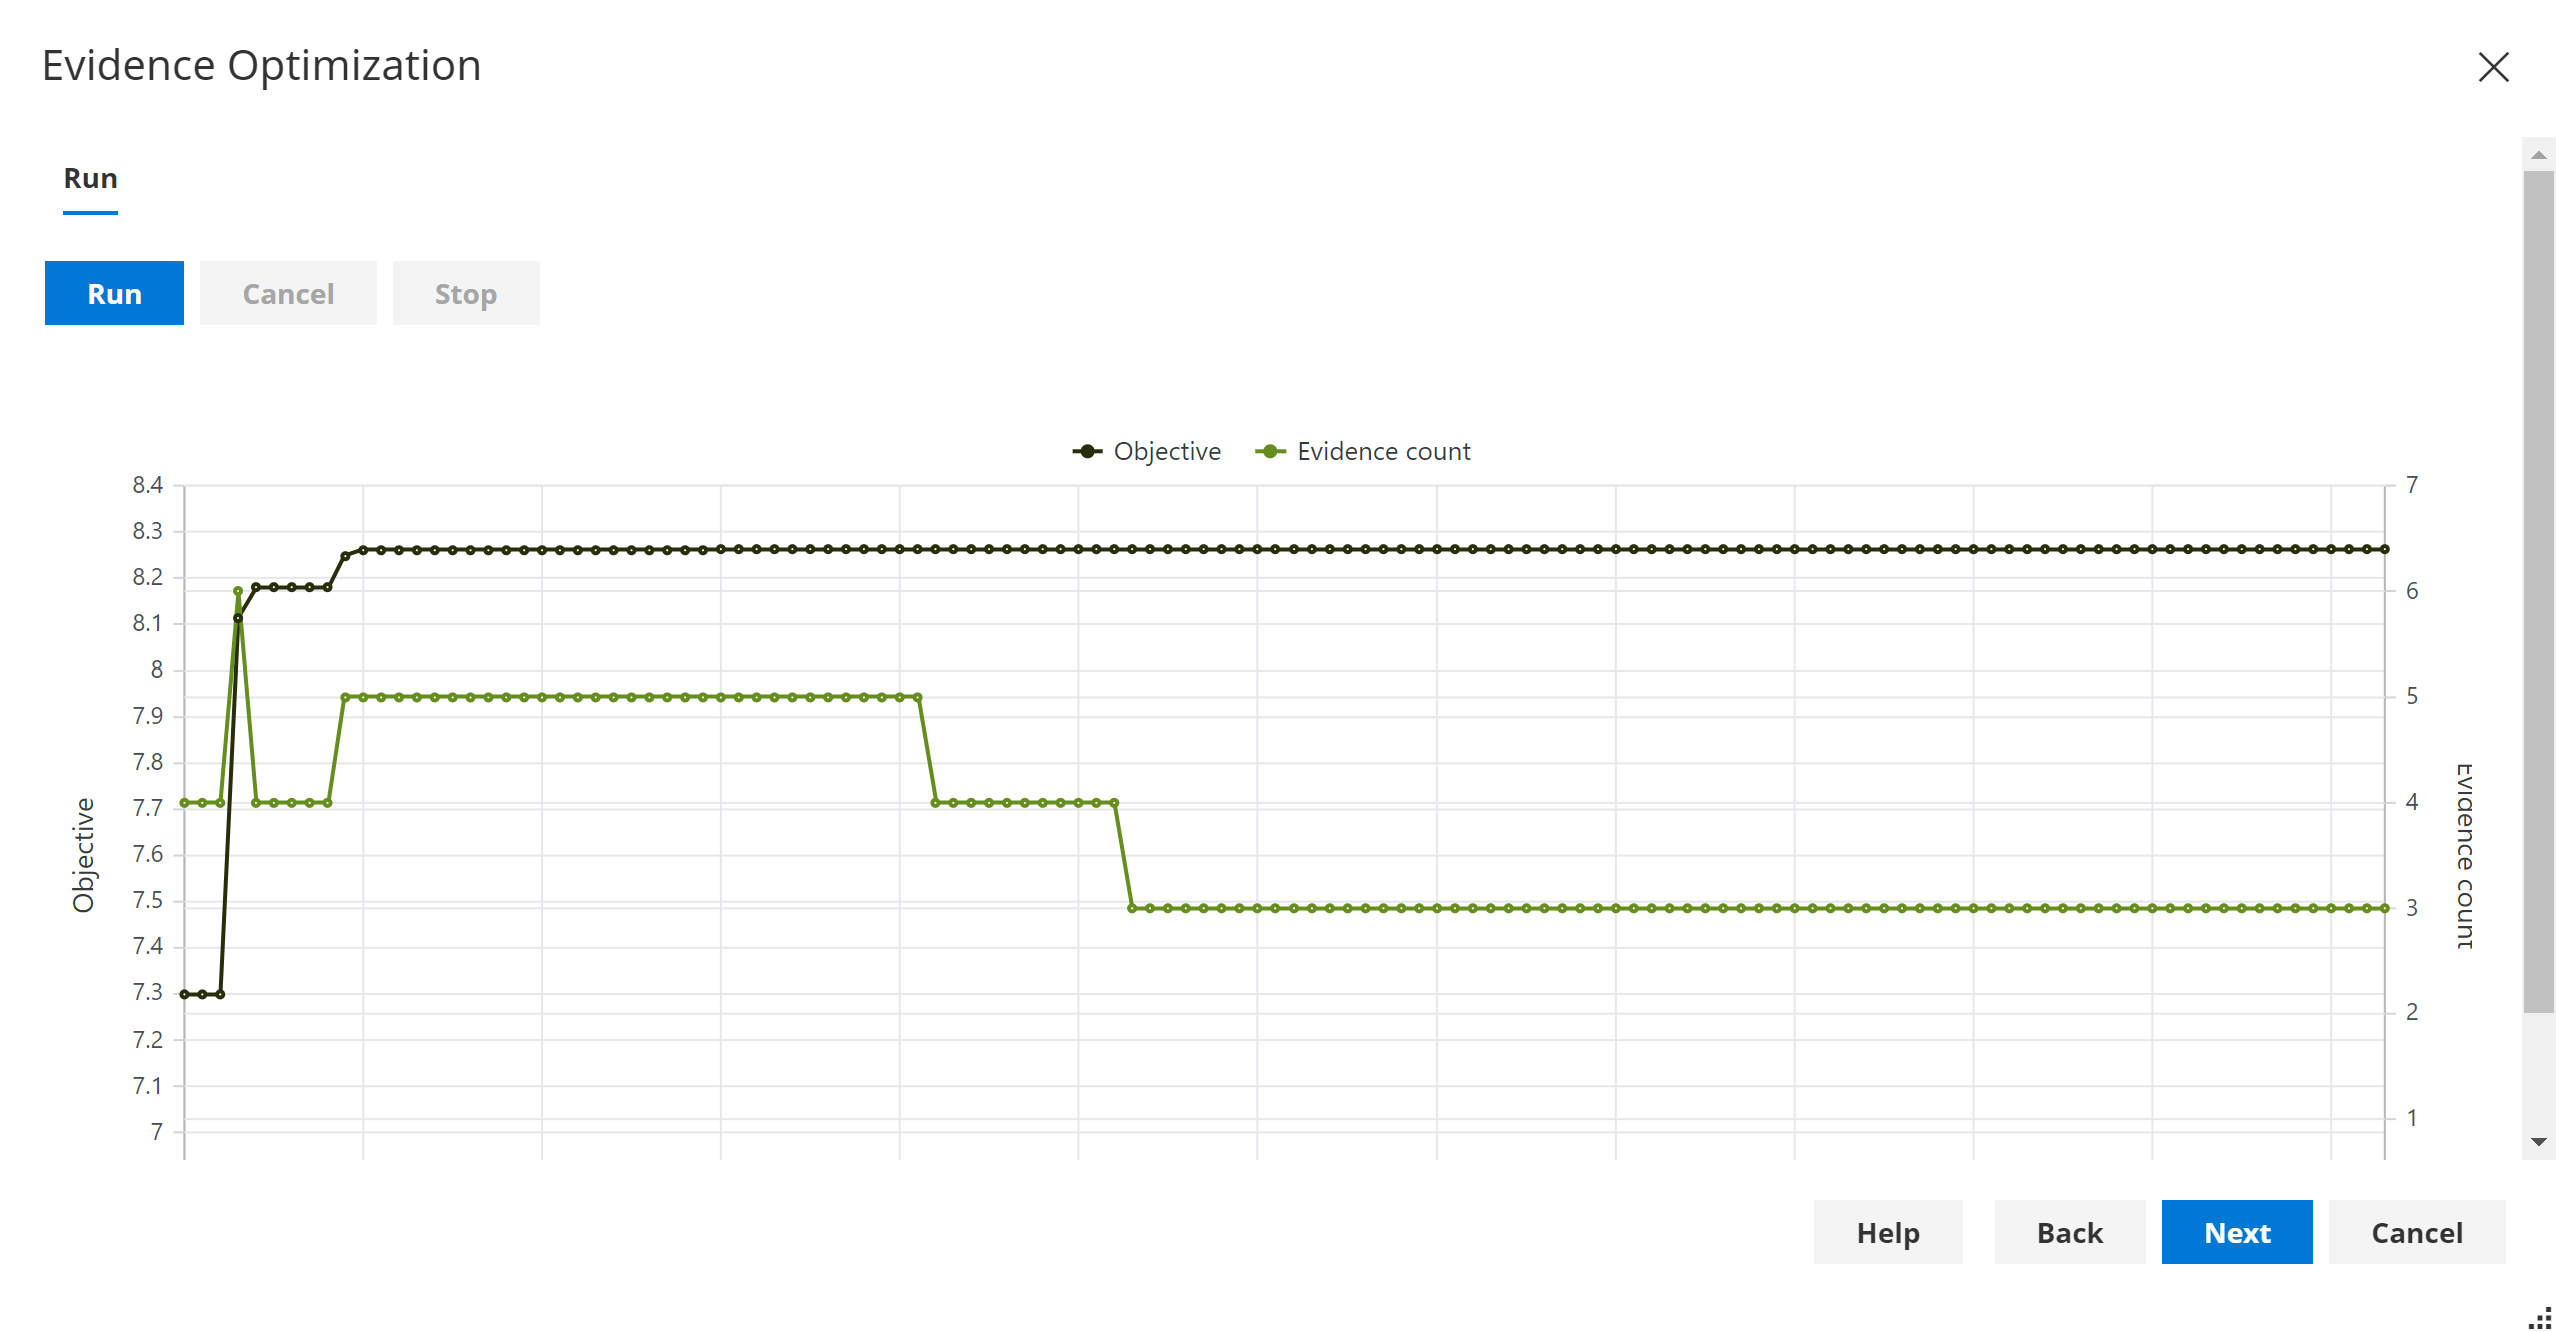
- Evidence optimization
ISO 31000 defines risk as the effect of uncertainty on objectives. Bayesian networks are a natural framework for managing uncertainty.
Advantages of Bayesian networks?
- Causal models - Naturally model cause and effect
- Allow reasoning forwards and backwards
- Designed specifically to natively handle uncertainty
- Can be built from Expert opinion and/or data
- Handle missing data
- Optionally allow us to optimize decisions based on costs/rewards (utilities) or using Evidence optimization.
- Support advanced analysis and diagnostics
- What if analysis?
- Sensitivity analysis (parameters or evidence input)
- Impact analysis
- Value of information
- etc...
How to make optimal risk-based decisions?
There are several approaches to making optimal decisions in Bayes Server.
For example, they allow us to determine the optimal strategy (set of policies) for managing risk.
- Evidence optimization & Causal Evidence Optimization allow us to Maximize/Minimize/Goal-Seek a function value, a continuous variable or a discrete state probability.
- Decision graphs extend the unifying framework of Bayesian networks which are based on probability, to allow us to optimize our decision making. Specifically, they add Decision nodes and Utility nodes, and perform an integrated optimization step which naturally handles uncertainty.
How do we put a value on human life? Organizations such as health services, drug administrations and defense organizations throughout the world do exactly this. The utility is typically a large negative number, to reflect the fact that this is highly undesirable, however most organizations would not exist if they took no risk, so it is important to be able to model these concepts.
Why probability and utilities instead of scores?
Scores are often used in an ad-hoc way to combine information in risk models. Unfortunately scores are typically not constructed using a robust probabilistic framework, cannot be further combined in a theoretically sound way, and prohibit reasoning both ways. Unfortunately they can also often lead to incorrect outputs.
For an in-depth introduction to decision automation see Decision automation.
Building a model
A risk modeling project might consider the following stages:
- Identify the threats.
- Determine which critical assets (or other concepts being modeled) are at risk from specific threats, and assess the likelihood of risk events occurring.
- Identify ways to reduce risks, both proactive and reactive.
- Prioritize, based on likelihood and optionally cost, and implement risk reduction measures, based on model output and analyses.
To construct a Bayesian network, we:
Add a node (variable) for each threat, event, control, consequence, etc...
- This can be done manually
- If we have a data set, we can define these automatically from data
- Use a mixture of both approaches
We then need to add links. As per the simple model shown at the top of the article, links are directed, and should typically flow from cause -> effect.
- With risk models, links are often added manually
- There are also approaches that attempt to learn the structure from data.
- Alternatively, for common or similar scenarios, we could create a template model and configure/extend it for each scenario.
Once the nodes and links have been added, all that is left is to specify the probabilities (parameters) for the model.
- Again, this can be done manually, through interviews with one or more experts
- Or we can learn all/part of our model using parameter learning.
At this point our model is complete, and we are ready to make predictions and perform advanced analyses.
Please see the in-depth Introduction to Bayesian networks for more information on how to construct Bayesian networks.
Flexibility
When building risk models with Bayesian networks we have a great degree of flexibility in how we construct our model.
In the example at the top of the page, we have shown a very simple model which includes a couple of risk events. However, Bayesian networks do not restrict the possible representations, so it is possible to represent the following:
- A hierarchy of risk events
- Risk event that link to each other
- Threats that link to each other
- Threats that link to multiple events
- etc...
Hierarchical models
Often risks in a large organization naturally mirror the organizational structure. i.e. Risks are gathered from teams/assets, and fed up the hierarchy to form an overarching risk model for the entire organization.
Building a risk model using Bayesian networks allows us to model this kind of scenario. We can either model them as separate networks, or we can include then in a single network and connect them together. The advantage of the latter approach is that we can perform analyses across the whole organization, reasoning forwards and backwards.
Discrete, continuous, discretization
As with normal Bayesian networks, nodes such as threats, events, consequences etc... can be discrete (e.g. Threat={None, Low, Medium, High} or Threat={False, True}), or can be continuous (e.g. Age of Asset) and if necessary continuous data can be discretized.
Risk analysis and modeling techniques
In the following sections we are going to explore various risk analysis and risk modeling techniques.
Strength of influence
This technique is used to help understand how strong the dependencies are between different threats, controls, events and consequences, etc...
We can calculate the strength of influence between any pair of nodes in a risk model based on Bayesian networks, using a tool called Association analysis.
We can also display associations between adjacent nodes as link strengths, as shown in the image at the top of the article.
Note that link strengths / associations are conditional on current evidence. i.e. they change dynamically as inputs change.
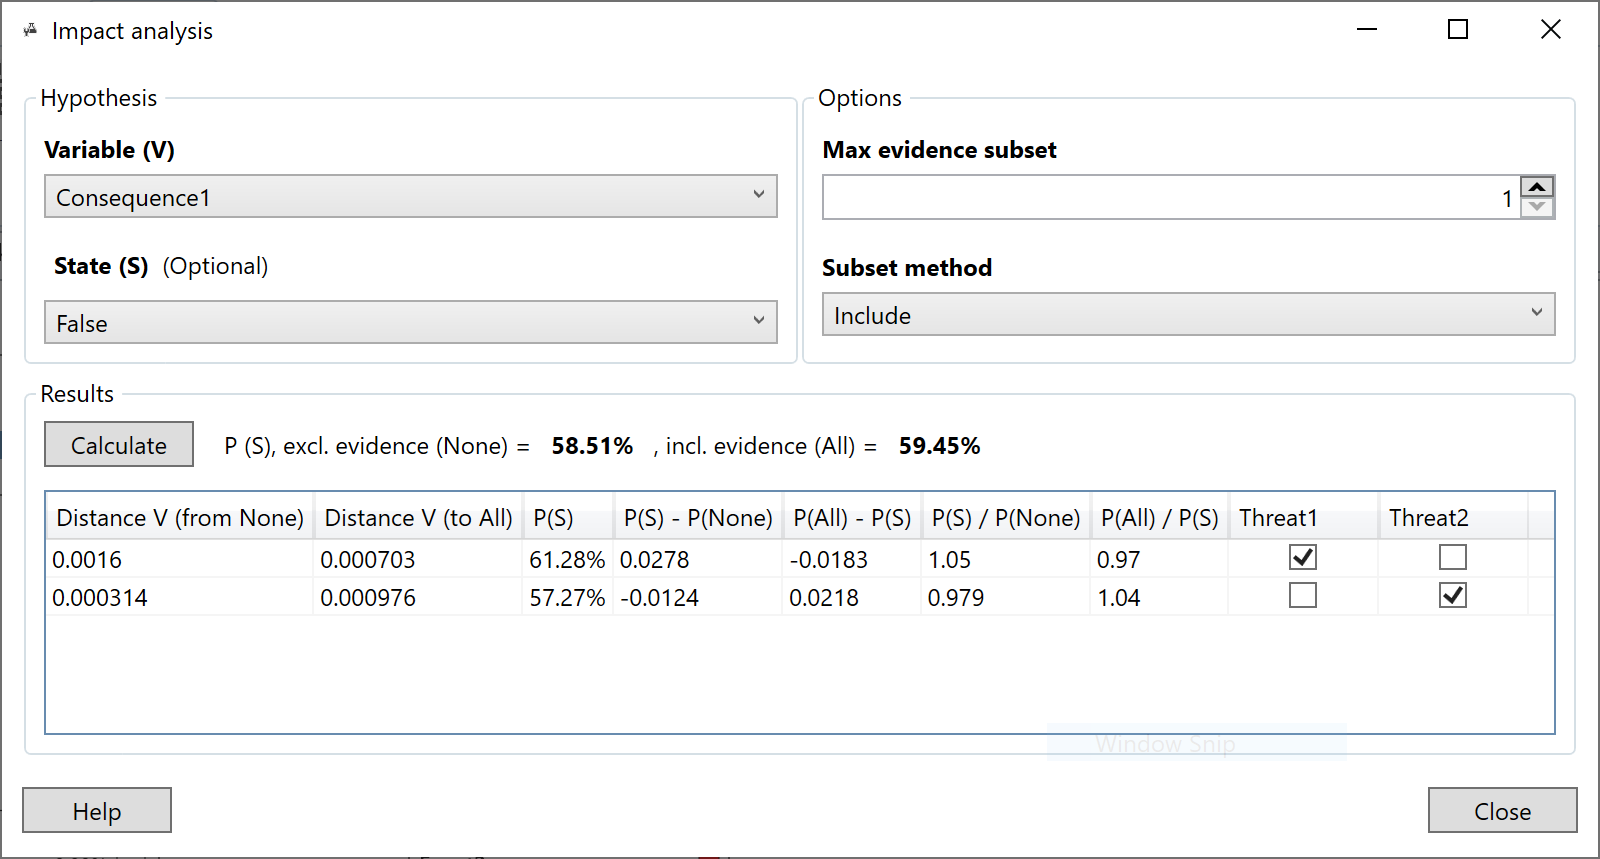
Impact analysis
Impact analysis allows us to analyze our inputs to the model (evidence) and assess which of those inputs is having the greatest impact of a risk event, consequence, etc...
Detecting unusual inputs or a change in the status quo
It is extremely important to monitor whether our risk model still fits new data coming in. If not, a) we should not trust any predictions, and b) we may need to re-learn of even re-engineer our model to cope with hitherto unseen events.
To do this, we can use a technique called Anomaly detection.
There are quite a few techniques available to perform anomaly detection, listed below.
- Anomaly detection (in depth article)
- Log-likelihood
- Log-likelihood analysis
- In-sample anomaly detection
- Conflict
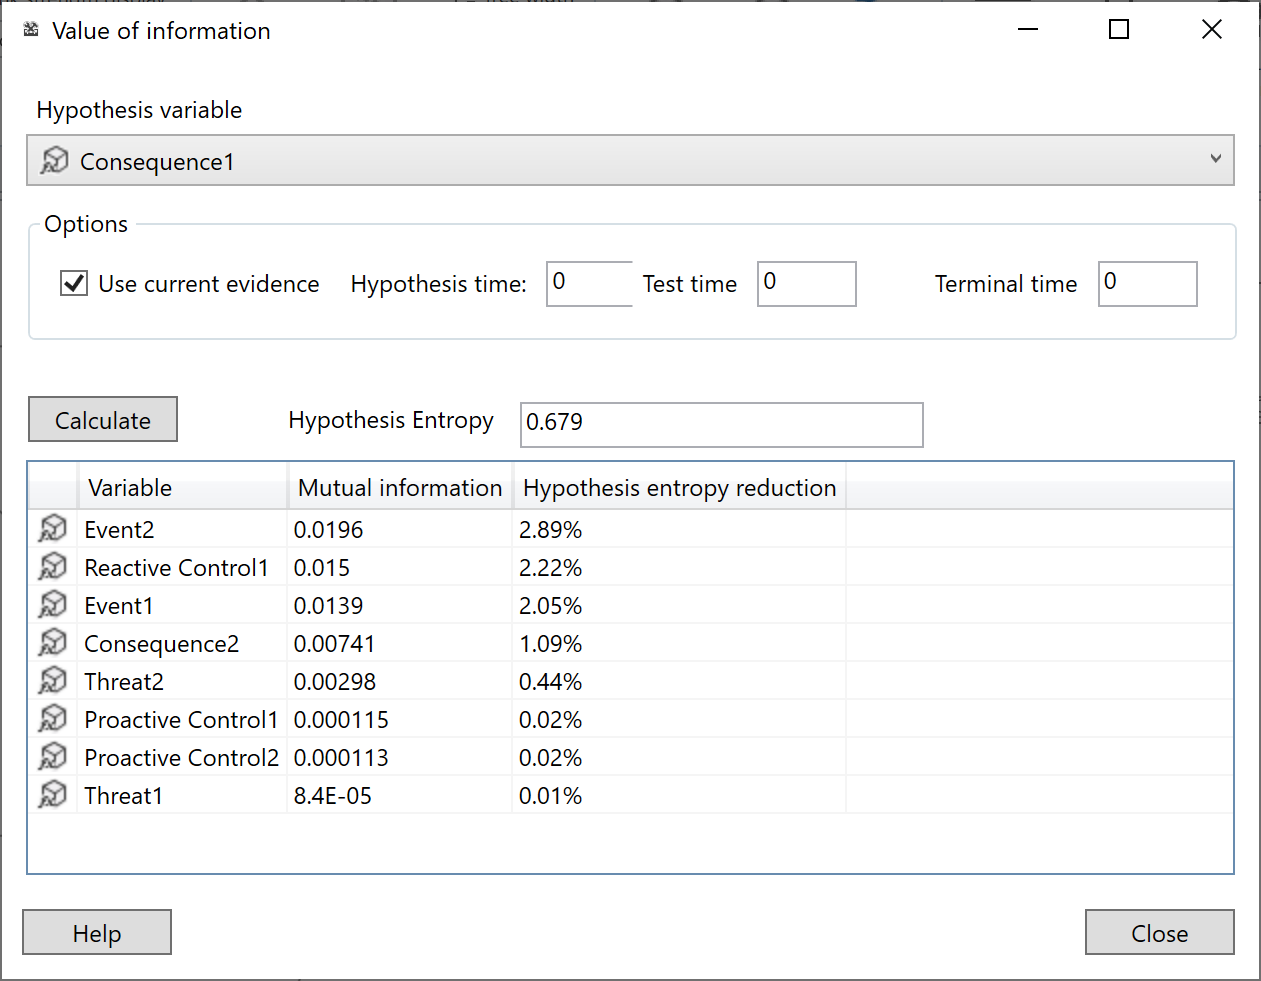
Value of information
Value of information is a very useful diagnostic tool. Once we have built a model and set inputs on our model, we can use it to help reduce the uncertainty of a node of interest.
For example we may be interested in a particular event E in our risk model with possible values {None, Low, Medium, High}. However with the current inputs (evidence), the predicted probability of E does not clearly show any state as particularly likely. Value of information, will tell us what other evidence will reduce the uncertainty the most.
There are two different related types of Value of information:
- Standard - solely based on the probabilities in a standard Bayesian network
- Utility - for Decision graphs, taking costs/rewards into account as well as the reduction in uncertainty.
Expert disagreement
When we manually determine the parameters of a risk model from experts, unfortunately experts do not always agree.
Note that we can learn all or parts of our model from data and/or manually define using experts.
To handle the case when experts disagree, we can use a technique called Expert Disagreement. We simply add a parent node, with a state for each expert as shown below.
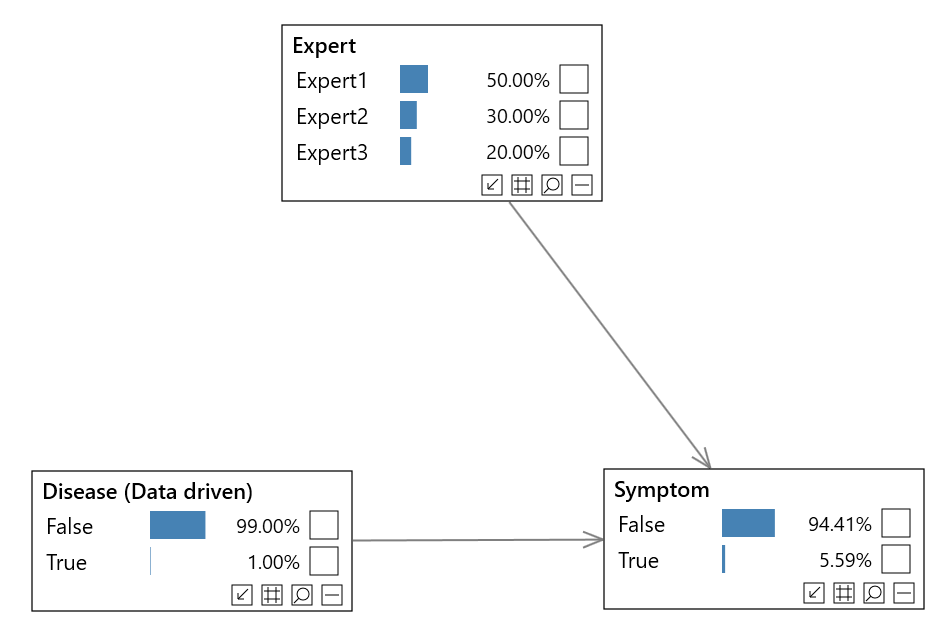
We give each expert an initial weight. We can even monitor their performance, and update their weights in an online fashion if we wish (see Online learning).
You can find an example of this type of model in the Bayes Server User Interface.
Joint queries
Bayesian networks are extremely flexible, both in terms of how we structure our nodes and links, but also in terms of how we are able to query (make predictions from) our risk model.
For example, using Custom queries we can calculate the following:
P stands for 'the probability of', a comma can be read as 'and', and the | symbol can be read 'given that we know'.
- P(Event1 | Threat1=True, Threat2=Low)
- P(Event1, Event2 | Threat1=True, Threat2=Low)
- P(Event1, Event2 | Threat1=True, Threat3=5.6)
- P(Event1, Consequence1 | Threat1=True)
- etc...
Note that we can still make predictions when we have missing data (unknowns). For example we may not have reliable information for all Threats.
Which parts of a model are not currently connected?
It can be useful to know, particularly for large risk models, which nodes in our risk model, if any, are not having any influence on a set of target nodes T of interest (e.g. T could be a particular risk event).
Note that this is context dependent, i.e. the result will change depending on the current inputs (evidence).
D-Separation is a tool that allows us to systematically perform these calculations.
Note that the target T does not have to be a single node.
Sensitivity analysis
Sensitivity to parameters allows us to check the sensitivity of the model outputs by analyzing the parameters of the risk model.
Parameter tuning
Parameter tuning allows us to automatically adjust the parameters (probabilities) of our risk model to match our expected output.
Have we captured all the required information from our data?
It can be difficult to know whether we have captured all the required threats, and whether we have linked them together in the best way.
When we have data to learn from, it can be useful to introduce a latent (hidden) variable into our model. We can use this additional variable to automatically capture information hidden in the data that we have not explicitly modeled, or give the model more expressive power to handle more complex relationships.
There are a few ways to do this:
If our latent variable has multiple states, this may indicate that there was hidden information that is not being explicitly modeled, or that their are more complex relationships.
We can use the Pattern analysis tool to automatically suggest what is interesting about the states of our new latent variable, which can help determine which information is not being explicitly modeled.
Identifying the most likely scenario
Risk models based on Bayesian networks naturally model uncertainty and allow any inputs to be missing or partially observed.
We do not have to have information about all threats to continue our analysis.
Also when we make predictions the risk model will output the probabilities of each event occurring (or more sophisticated queries including multiple nodes if needed).
Sometimes it is desirable to understand the most likely situation, and Most probable explanation allows to determine this, given what we already know.
Pattern analysis
Once we have built a risk model, we can use sophisticated analysis tools to automatically uncover interesting information encoded in our model.
There are a number of tools to help us:
Missing or partially observed inputs
When working with a risk model based on Bayesian networks, not all nodes such as threats need to have known values, in order to use the model.
Bayesian networks naturally handle missing data, whether it is discrete, e.g. Country = {US, UK, Japn, etc...}, or continuous, e.g. Age.
We can also set a different type of evidence, called Virtual or Soft evidence. This allows us to express the uncertainty in our inputs (evidence).
For example a threat may have states {None, Low, Medium, High} and the current assessment indicates that the state is either None or Low, and is more likely to be Low than None. Soft/Virtual evidence allows us to apply a probability to the evidence on each state, e.g. {None=0.4, Low=0.6, Medium=0.0, High=0.0}.
Time series
It is worth mentioning that Bayesian networks can be extended to handle time-series and sequences. They are extended with so called Temporal nodes, and are then referred to as Dynamic Bayesian networks or just DBNs.
The majority of risk models do not require DBNs. Even though information in a risk model flows from causes to effects, which will most likely include a time delay, they typically do not require temporal nodes. Temporal nodes are useful when it is important to directly model the change in nodes over time, and directly model their temporal relationships in order to make sound judgments (predictions). This is very different to simply monitoring the output of a risk model over time.
Modeling large numbers of threats or other factors
When the number of parents of a discrete node in a Bayesian network is large, the number of probabilities required becomes cumbersome, unrealistic to assess, and often makes prediction (inference) intractable.
A technique which is often used in medical diagnosis, which in many ways is quite similar to risk modeling, is Noisy nodes. This allows us to make simplifications which makes prediction and assessment possible.
Summary
Bayesian networks and optionally Decision Graphs, are a robust unifying framework for risk modeling. They not only provide a sound probabilistic basis from which to build models and perform advanced analyses, but optionally extend this with a theoretically sound way to incorporate rewards and costs (utilities), and optimize decision making.
To get started with Bayesian networks and Decision graphs, there are lots of resources available: