Introduction to decision automation
Introduction
Decision automation, also known as prescriptive analytics, enables us to make decisions automatically using a computer or at least help us make those decisions (augmentation).
A predictive model is able to take inputs and predict one or more outputs, and even provide certainties around those predictions, however these outputs only tells us the likely state of our system given what we know. They do not tell us what decisions to make given these outputs. There may be multiple competing decisions that can be made, all with different cost/profit implications. This is where decision automation comes in.
Bayes Server supports a number of approaches to decision automation, Decision Graphs and also Evidence optimization which helps minimize/maximize/goal-seek a function/continuous variable/discrete state.
Decision automation example
As an example let us consider a consultation with a doctor, whether it be a physical doctor, or an artificial intelligence based system. At the beginning of the consultation, the doctor will most likely ask what symptoms you are experiencing. Given these symptoms, the doctor will start to get an idea of what diseases are likely to be the cause, and also which other symptoms may be present. In order to decrease the uncertainty in the most likely diseases, the doctor may ask you about other likely symptoms. Once you have provided this additional information, the doctor's belief about which diseases are most likely will change. This process may then be repeated.
We have not yet got to the point where the doctor needs to make a decision (prescription), however we have already covered some key concepts:
- Diagnostics: Determining the most likely disease(s) from one or more symptoms. Since diseases typically cause symptoms ths process is known as diagnostics or making a diagnosis.
- Prediction: Determining which other symptoms are most likely. From the current symptoms, a model can not only diagnose the most likely diseases, but can at the same time predict which other symptoms are most likely present.
- Value of information: A technique which can guide the doctor when trying to narrow down the choice of likely diseases. It does this by telling them which symptoms, if known, will reduce the uncertainty the most. Note that this may not end up being the most likely symptoms. For example, a high temperature may be very likely given the symptoms, but may also be associated with many different diseases. Value of information takes this into account.
Prescription
Once the doctor is happy they have explored the patient's symptoms, they will suspect different diseases will different certainties. At this point the doctor may send the patient for further tests and/or prescribe some medication. Both of these actions are decisions, and typically involve both the uncertainty around each possible disease, costs of tests and/or medication.
This is the decision making process (prescription).
In this article we discover how by extending a Bayesian network we can automate this decision making process.
Prognostics
Although we will not talk further about it in this article, another role of a doctor may be prognostics. This is the process of predicting the remaining life of an asset such as an engineering component, or in our example, the remaining life (or other aspect) of a patient.
Decision automation vs optimization
Decision automation is a form of optimization however the key difference to traditional optimization is that here we are interested in decision making under uncertainty. I.e. we do not know for sure the current state of the environment, instead we are working with beliefs/probability distributions.
Decision graphs
Decision graphs, also known as influence diagrams, extend Bayesian networks enabling us to automate the decision making process.
They support two new node types which make this possible, decision nodes and utility nodes.
Decision nodes
A decision node is much like a standard discrete node in a Bayesian network, however each state represents a different action that can be taken for that decision. For example, {Buy, sell}, {Drill, Do not Drill}, {XRay, MRI, No scan}, etc...
A Decision graph can contain multiple decision nodes.
Often there are multiple decisions that can be made. Some may depend on others, some may not. Often different decisions can be conflicting, making the automation of decisions even more powerful, as humans will find the process harder.
Utility nodes
A utility node allows the usefulness of a situation to be measured, typically in currency terms (e.g. $).
Costs are encoded as negative utilities.
For example, the cost of providing a patient with a medication might be $50. This would be encoded as a utility of -50.
Note however that the overall utility of choosing to give a patient a medication, as calculated by a Decision Graph, may end up being positive, if the response (positive utility) outweighs the cost.
Cost of life
In many cases it is necessary to attach a utility to a human life, or concepts that are somewhat subjective.
In fact, this is not as big a problem as it might seem, and is routinely performed in heath-care and military when deciding whether to make a drug available or when deciding whether to provide certain military equipment.
Data / expert opinion
The parameters of a Decision graph in Bayes Server can be learned from data and/or expert opinion.
When learning some or all of the network from data, Parameter learning can be performed in the usual way. To learn utility/decision nodes, the data should include information about past decisions that were made, and the utilities (e.g. costs/profits) associated with those decisions.
Decision making
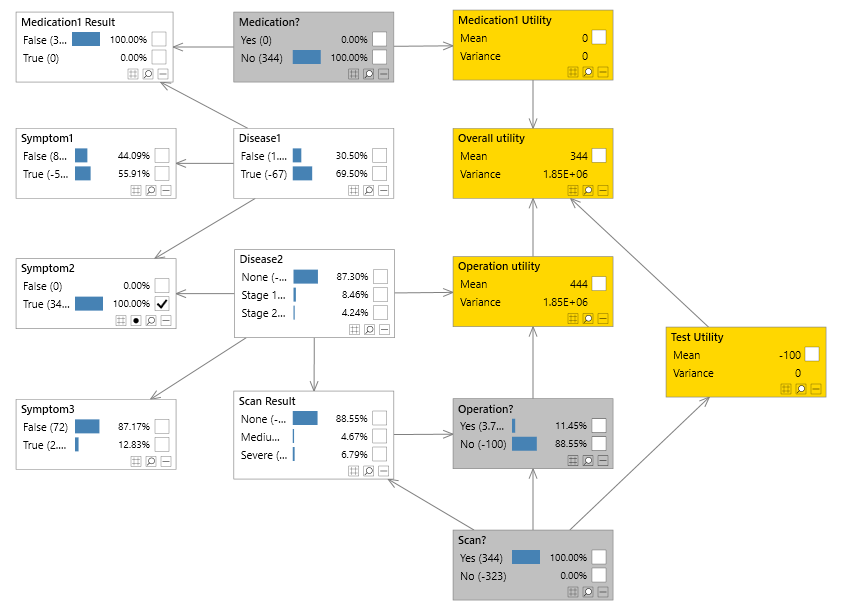
Once a Decision graph has been constructed it can then be used to make decisions in real time. In the same way that you would for a standard Bayesian network, you first enter evidence on variables that are known (e.g. Symptom1 = True). The Decision graph can then be used to determine the probability of each decision state and the utility of these decisions.
The end user might be a key decision maker, or could equally be another computer.
Cost/profit surfaces
Utilities in Bayes Server are themselves continuous distributions much like standard continuous variables. When we learn these utilities from data (or enter them manually) we end up with a distribution, which might be a Gaussian, a multi-variate Gaussian or a mixture of multi-variate Gaussians for example.
Utilities can also be point Gaussians (zero variance/covariance).
The upshot of this is that any queries we subsequently perform on utility nodes also return distributions.
We can query individual utility variables, joint queries over multiple utility/non utility variables, or even mixtures of joint distributions.
This allows us to plot cost/profit surfaces
Example queries
If a network contained standard discrete variables S1, S2, standard continuous variables C1 & C2, utility variables U1 & U2, and decision variables D1 & D2 we could perform queries such as the following:
- P(U1), P(U2)
- P(D1), P(D2)
- P(U1, U2)
- P(U1, U2 | D1, D2)
- P(U1, U2 | D1, S1)
- ... and so on