Diagnostics, troubleshooting & reasoning | Bayesian networks
In this article we look at a number of useful techniques for performing diagnostics, troubleshooting and reasoning with Bayesian networks.
Diagnostics
Some examples of the application of diagnostics are given below.
- We know a patient's symptoms and subsequently want to diagnose one or more diseases
- We have events recorded by an on-board computer in a car, and want to determine what the most likely faults are
- We have detected an anomaly from sensor data, and want to determine which sensors are causing that anomaly
- We have diagnosed a fault in a component and want to know which other components in the system will be affected
- We want to design fault tolerance into a system, and to do this we diagnose weaknesses in the system
- A troubleshooting system helps an operator determine the most likely faults/diseases, and then helps them decide what additional information that would help the diagnosis.
Inputs -> outputs
Before we describe diagnostics we will first describe prediction, which typically is concerned with determining the likely value of one or more outputs given what we know about one or more inputs.
Prediction is the process of reasoning forwards from inputs to outputs.
Outputs -> Inputs
Unlike prediction, diagnostics is concerned with determining the likely value of inputs given what we know about one or more outputs (and also sometimes what we know about other inputs).
:::info Diagnostics can be thought of as the process of reasoning backwards from outputs to inputs, but typically is a mixture of both forwards and backwards reasoning. :::
In fact with Bayesian networks the concept of inputs and outputs is too simplistic, as they are more general than that. They use a graph structure (Directed acyclic graph), from which we can compute the probability of any node(s) in the graph.
Also, sometimes the distinction between input and output is not clear cut, but that is not a problem for Bayesian networks.
With Bayesian networks we can reason forwards and backwards.
The term infer (or inference) is a more general term that covers both prediction, diagnostics, and the calculation of any other node(s) in the graph.
We could even calculate the joint probability of an input and output.
Missing data
Bayesian networks can perform these calculations (prediction, diagnostics, general inference) when the state of one or more variables is unknown. For example we have evidence (know the value of) some outputs and some inputs but would like to compute the other variables given what we know.
Bayesian networks are particularly well suited to diagnostics, because they can handle both prediction and diagnostics and also natively handle missing data.
Troubleshooting
Troubleshooting is a form of diagnostics which typically starts at the point when we have recorded certain events or symptoms, which are typically the 'outputs' of the system.
Cause & effect
Although Bayesian networks are not necessarily causal, it can be useful to think of them as such when trying to understand why events/symptoms would be considered 'outputs' in the system.
In the image below, links are directed from Faults/Diseases to events/symptoms. This makes sense because it is the fault/disease that is giving rise to (causing) the events/symptoms.
Even though links in a Bayesian network are directed, this does not mean that information cannot flow both ways. In fact there are rules which determine how information flows backwards and forwards through the graph, and they depend on both the graph structure and which evidence set.
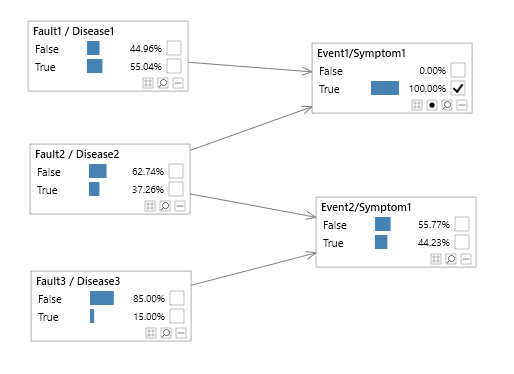
In this simple example, you can therefore think of the Faults/Diseases as the 'inputs' and the Events/Symptoms as the 'outputs'.
Determining the most likely faults
Having entered evidence about the 'outputs' of the system, we typically use the Bayesian network to query the probability of each fault/diseases in the system.
Note that as Bayesian networks handle missing data, information about either the outputs or inputs can be unknown (missing) or in some cases it might be appropriate to use soft/virtual evidence.
If we subsequently sort the Faults/Diseases by their probability of being True (given what we know about the Events/Symptoms) we have a list of most likely Faults/Diseases.
Performing additional tests
Once we have a list of most likely Faults/Diseases the next step may be to perform an addition check/test to determine if the fault/disease has been correctly identified.
Of course there may be more than one Fault/Disease, and in fact they may be related. Because of their graph structure, Bayesian networks naturally handle multiple Faults/Diseases and also multiple Events/Symptoms, and inputs can be connected to other inputs, output to other outputs, and latent variables can capture complex hidden relationships in the data.
Side effects
When we perform additional tests we need to be mindful of any side effects of the tests.
Perhaps if we visually inspect a suspect component, or perform a blood test, we may reasonably well expect there to be no side effects to the system/patient. If this is the case we can update the Bayesian network in light of the new evidence.
I.e. if the test reports that the Fault/Diseases is not present, we can set evidence on that node to False and the Bayesian network will update the beliefs of the remaining inputs and outputs, which will lead to a new list of suspected Faults/Diseases.
However, if a test has a side effect we may need to re-record the state of the system.
For example if a troubleshooting systems suggests a problem with the spark plugs in a car, we may subsequently replace or clean the spark plugs. Having performed this action (intervention) if may be important to re-record the events from the system, as they may have changed as a result of the action, regardless of whether our action fixed the problem.
As another example, if our system identifies a particular disease as being likely, and a doctor subsequently prescribes medication or performs an operation, our knowledge is out of date. We may need to record the presence or absence of symptoms, take new blood pressure readings etc...
Repeating the procedure
Having carried out additional tests, and perhaps re-recording our evidence, we can repeat the procedure. We will have a new list of most likely faults, and can therefore perform additional tests and so on.
Decision trees
Bayesian networks are more powerful than simple troubleshooting systems built from Decision trees. This is because Bayesian networks are based on graphs (directed), and information can flow backwards and forwards multiple times through the graph during the diagnostics process which updates dynamically as new evidence is gathered.
Value of information
Perhaps our Bayesian networks is suggesting a particular fault/disease, however the probability is not as high as we would like. Perhaps the test associated with the fault/disease of interest is very expensive, or there is a shortage of trained staff to carry out the test.
Before we proceed we would like to increase the certainty of the Fault being either True or False. We can do this using a technique called Value of Information.
Value of information can identify other nodes in the network which if known, will reduce our uncertainty in the fault/Disease. It will order any nodes in the network which do not yet have known values (i.e. are missing) by the amount by which they reduce this uncertainty.
If there are suitable candidates we can then determine the known value of one or more nodes in order to increase our understanding about the Fault/Disease in question. This may lead us to suspect the Fault/Disease more and carry out the test, or decide that in fact that Fault/Disease is unlikely.
There are a number of different ways in which we may gather additional information.
- Check other events or question a patient about additional symptoms
- Carry out a different test (perhaps because it is cheaper). Knowing the result which then change our belief in other Faults/Diseases (and Events/Symptoms also).
Decision automation
We may want to model the costs associated with various tests directly in our Bayesian network and even help make decisions.
We can do this with Decision Graphs or Evidence optimization.
Decision graphs extend Bayesian networks with the concept of utilities and decisions. Utilities can be thought of as negative costs, or the usefulness of doing something. In diagnostics, utilities can be used to represent tests. If a test costs money, then the utility of a test is negative. For example, the utility of carrying out a specific blood test might be -100 USD.
Decisions can be added to the Bayesian network to help the operator (or another computer) decide the best course of action, given the current evidence and costs involved.
For example, a decision might be whether to carry out a particular test.
Tracing anomalies
We can use Bayesian networks for Anomaly detection. Once an anomaly has been detected, another form of diagnostics is concerned with tracing the source of the anomaly.
For example:
- Which sensors on a component are responsible for the anomaly?
- Our predictive model is inconsistent with new data coming in, and hence unreliable. Which data is inconsistent?
Unsupervised anomaly detection is particularly useful for predictive maintenance. Predictive maintenance, also known as system health monitoring or condition based maintenance, is used to monitor the health of assets, such as components in a car or aircraft. We build models of normal behavior, as failures are typically rare or occur in different ways, and monitor those components.
Anomaly detection is also very useful for model verification. If we have built a model, and are relying on it for predictions, it is important to know whether data being used to make predictions is consistent with the model. If not, should we really trust the predictions?
Retracted log-likelihood
With unsupervised approaches, we can make use of the log-likelihood of the Bayesian network as an anomaly score. We can also use a normalized version, as explained in the article on anomaly detection.
Conflict is another useful metric.
When the anomaly score detects anomalous behavior, we are usually then interested in diagnosing the cause of that anomaly.
We can do this by testing the anomaly score without evidence set on a subset of variables in the Bayesian network.
We can test the anomaly score in the following ways:
- For each variable X with evidence, test the anomaly score without evidence set on X.
- For each pair of variables X and Y with evidence, test the anomaly score without evidence set on X and Y
- etc...
In this way, we can see the effect of each variable or subset of variables on the anomaly score, and use this to better understand (diagnose) the nature of the anomaly.
Impact
Impact analysis is similar to retracted log-likelihood, except we are interested in the change to a particular hypothesis variable X.
We can test the change to the probability of X based on different subsets of evidence.
As with retracted log-likelihood, we may consider the removal of each evidence variable in turn. We may go further and decide to also test the exclusion of pairs of evidence.
Impact analysis is useful during diagnostics. For example, we can determine which Events/Symptoms are having the biggest impact on a suspected Fault/Disease.
Retracted evidence
Retracted evidence can be used to see what the probability of a variable X would have been if X did not have evidence set on it. Importantly, any other variables being queried at the same time, will still use the evidence set on X.
This is useful in a diagnostic setting as you can look at a variable X and compare the evidence set on it to what the other variables are saying it should be. If there is a discrepancy, it can aid diagnosing what the problem is.
Joint queries
Sometimes the probability of an individual Fault/Disease is not enough. Given the current evidence (i.e. what we know so far) we may be interested in the joint probability of two or more Faults occurring, two or more symptoms, or perhaps the joint probability of a Fault and a Symptom occurring.
Bayes Server supports joint and conditional probability queries. See Custom queries for more information.
Most probable explanation
Sometimes during the diagnostics process we may be interested in knowing what the most likely scenario is given the current evidence. I.e. what is the most likely configuration of all the other variables, given what we currently know.
You can use a technique called Most probable explanation to do this.
Auto insight & comparison queries
Automated insight can be useful when identifying differences between individual assets within a fleet of the same type of asset. For example, an individual aircraft engine within a fleet of aircraft fitted with the same engine.
If an asset is under performing or raising undesirable events, it can be useful to compare that asset with the fleet. Auto insight will highlight any difference, and rank those differences in order of importance.
For more information, please see the following:
Automated insight - user interface
Time series
Bayes server supports Dynamic Bayesian networks which extend the concept of standard Bayesian networks with time.
We can therefore use diagnostic techniques that take into account the timing of events/symptoms.
FMECA
While seemingly unrelated to Bayesian networks, Failure mode, effects, and criticality analysis (FMECA) is a technique which is often used to analyze the consequences of a failure within a complex system and the severity of those consequences.
This can be thought of as a form of diagnostics, as we are interested in the ripple effect when things go wrong.
Instead of a standard FMECA analysis, Bayesian networks can also be used to model the relationships between components of a complex system and their probabilities of failure. The advantages are given below:
- Bayesian networks can reason forwards and backwards.
- Bayesian networks support missing data.
- Complex analyses can be carried out, the likes of which are covered in this article.
- Bayesian networks can be extended to include utilities and decisions.