Sensitivity to parameters
Introduction
Sensitivity to parameters is used to determine how the probability of a variable of interest (the hypothesis variable) is affected when the value of one or more parameters in the network are changed.
If you want to find the value/range of a parameter value which results in a certain probability (or range) for the hypothesis variable, see Parameter tuning.
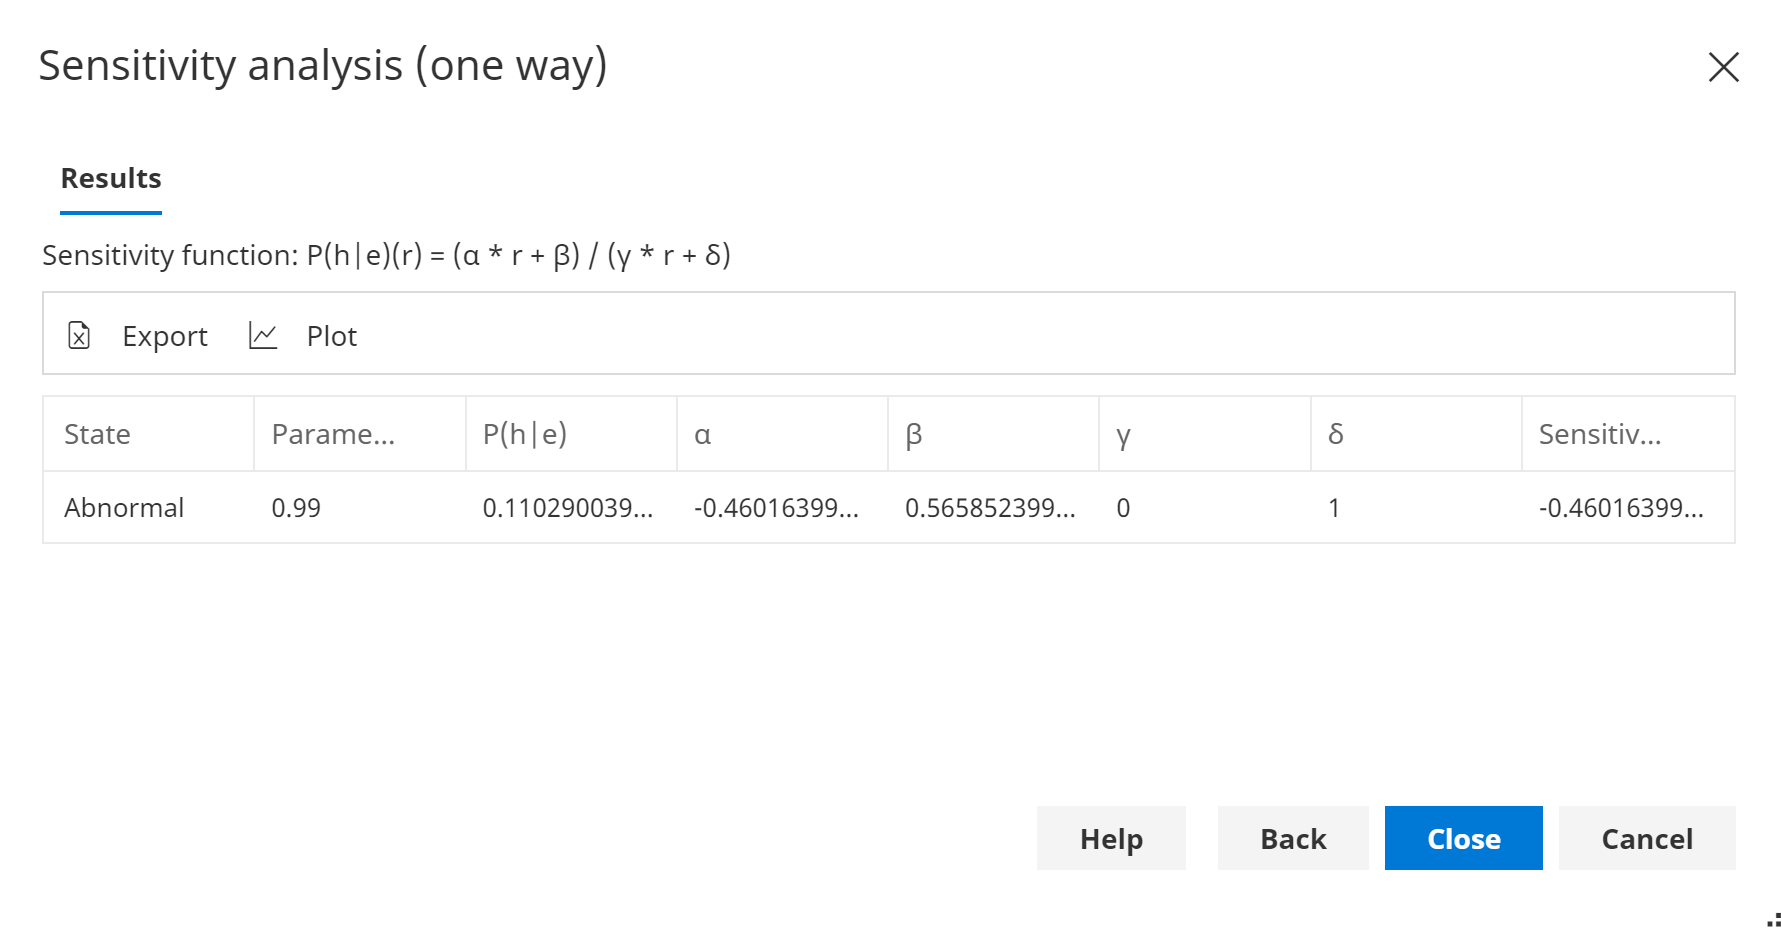
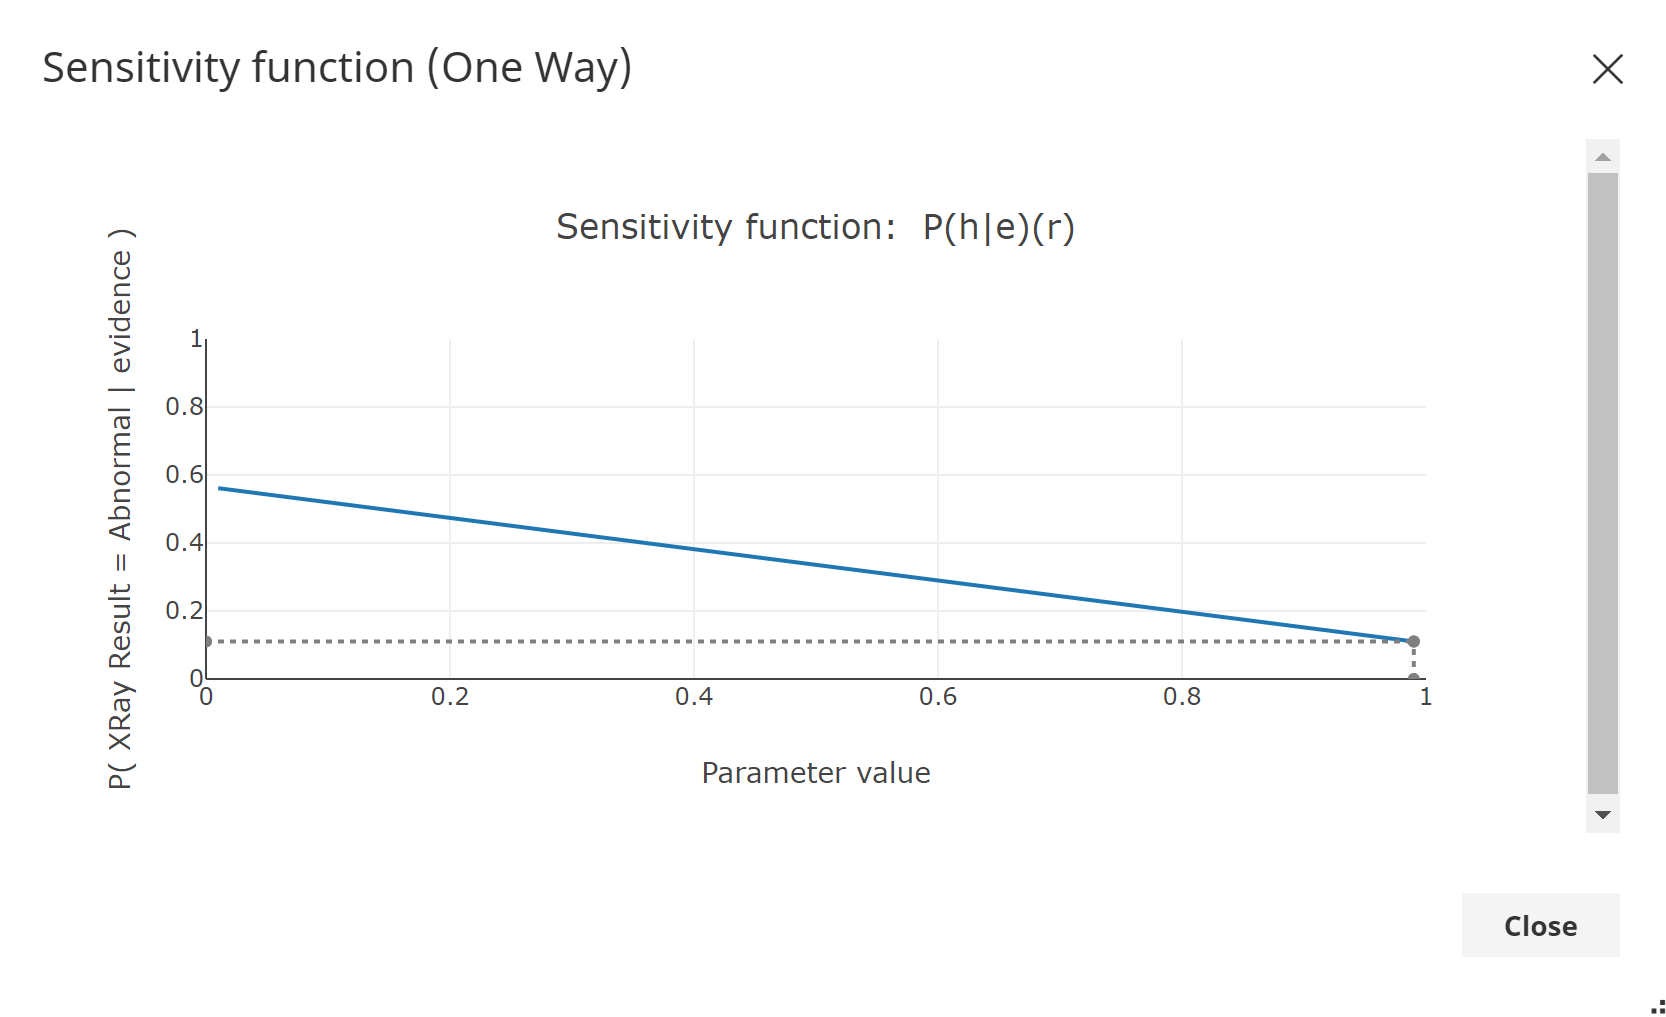
One way sensitivity to parameters
One way sensitivity to parameters computes the probability of a hypothesis state given any evidence that may be set P(h|e)), as a function of a parameter of interest.
The result is known as a sensitivity function. Given a sensitivity function, you can pass in a value for the parameter and retrieve P(h|e).
A plot of P(h|e) is generated over a range of parameter values in order to analyze how sensitive the hypothesis is to the parameter.
The current value of the parameter is shown on the plot, so that you can see how sensitive the hypothesis is around the current parameter value.
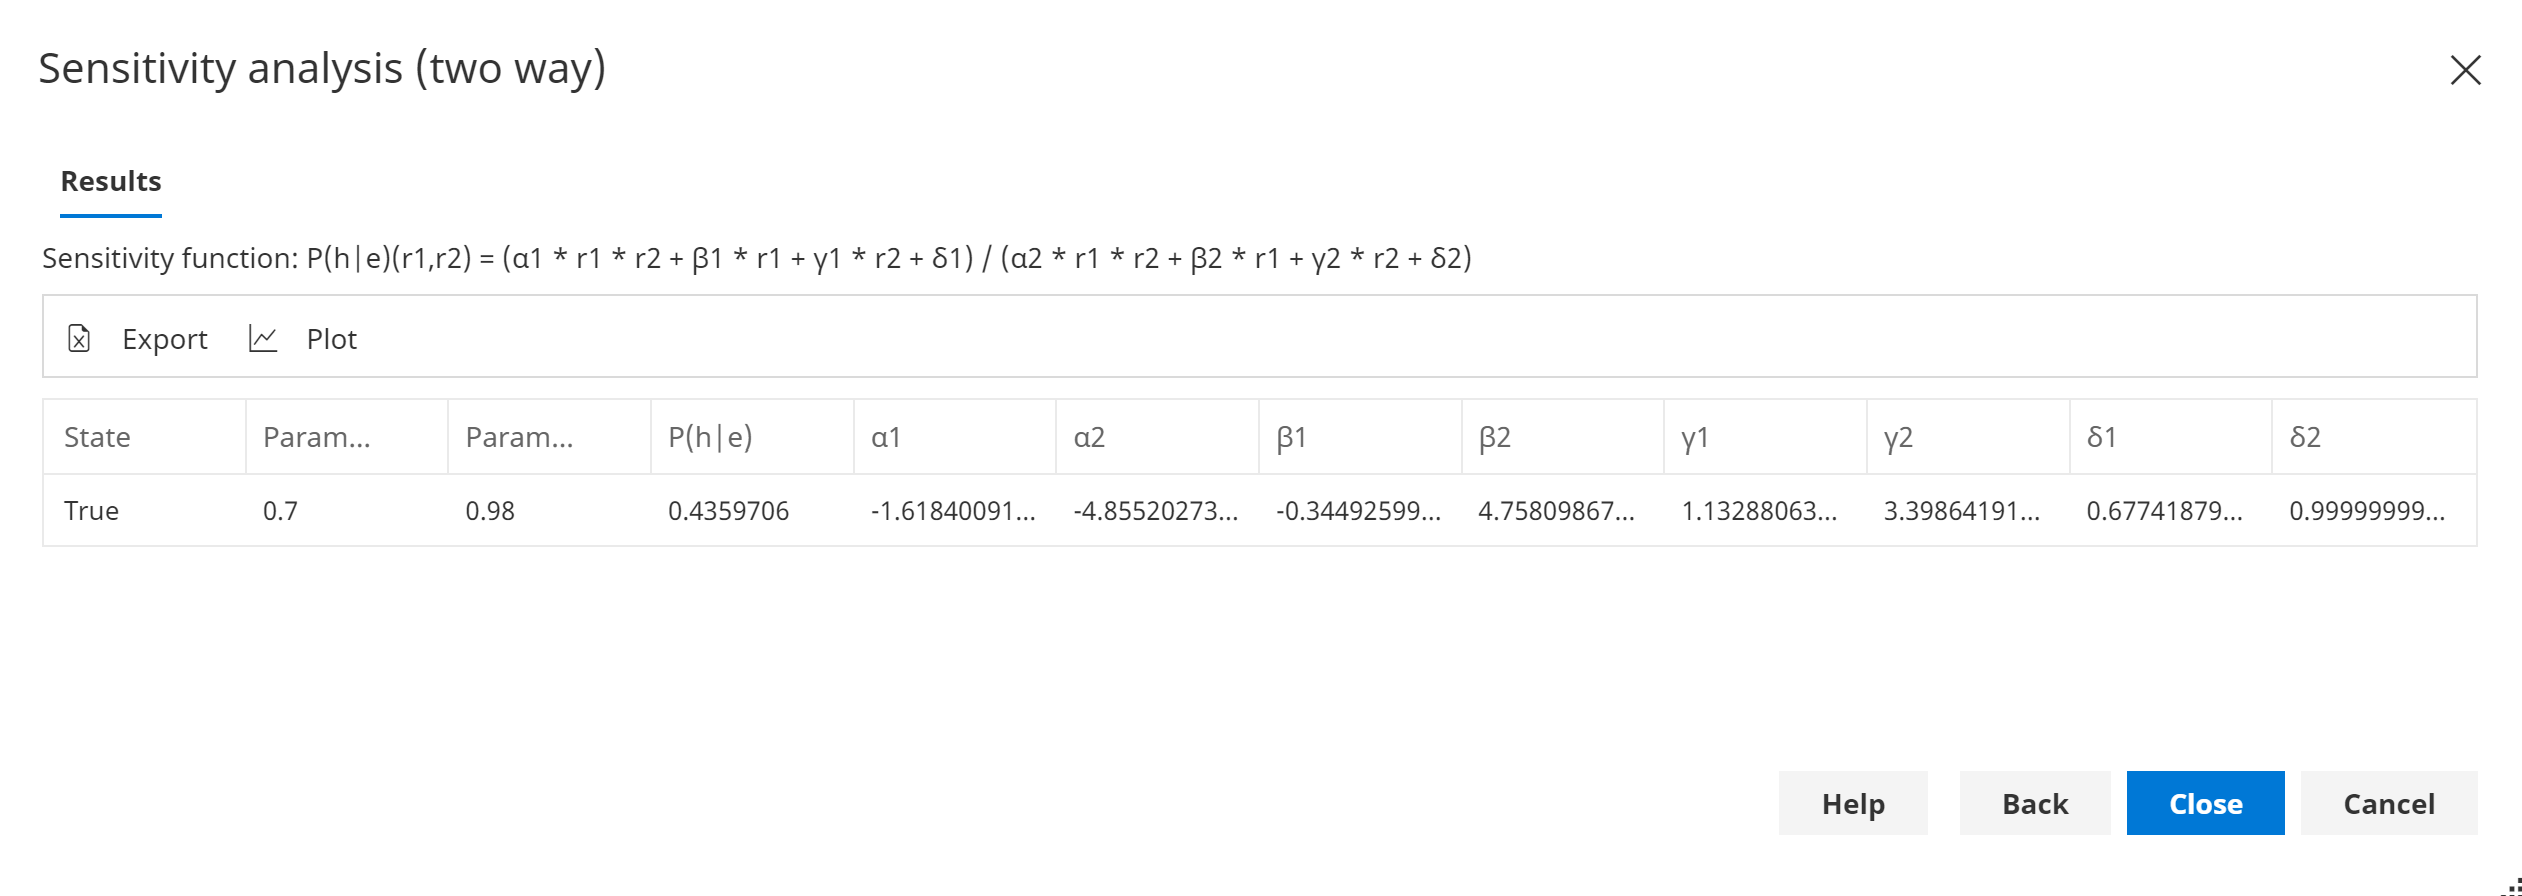
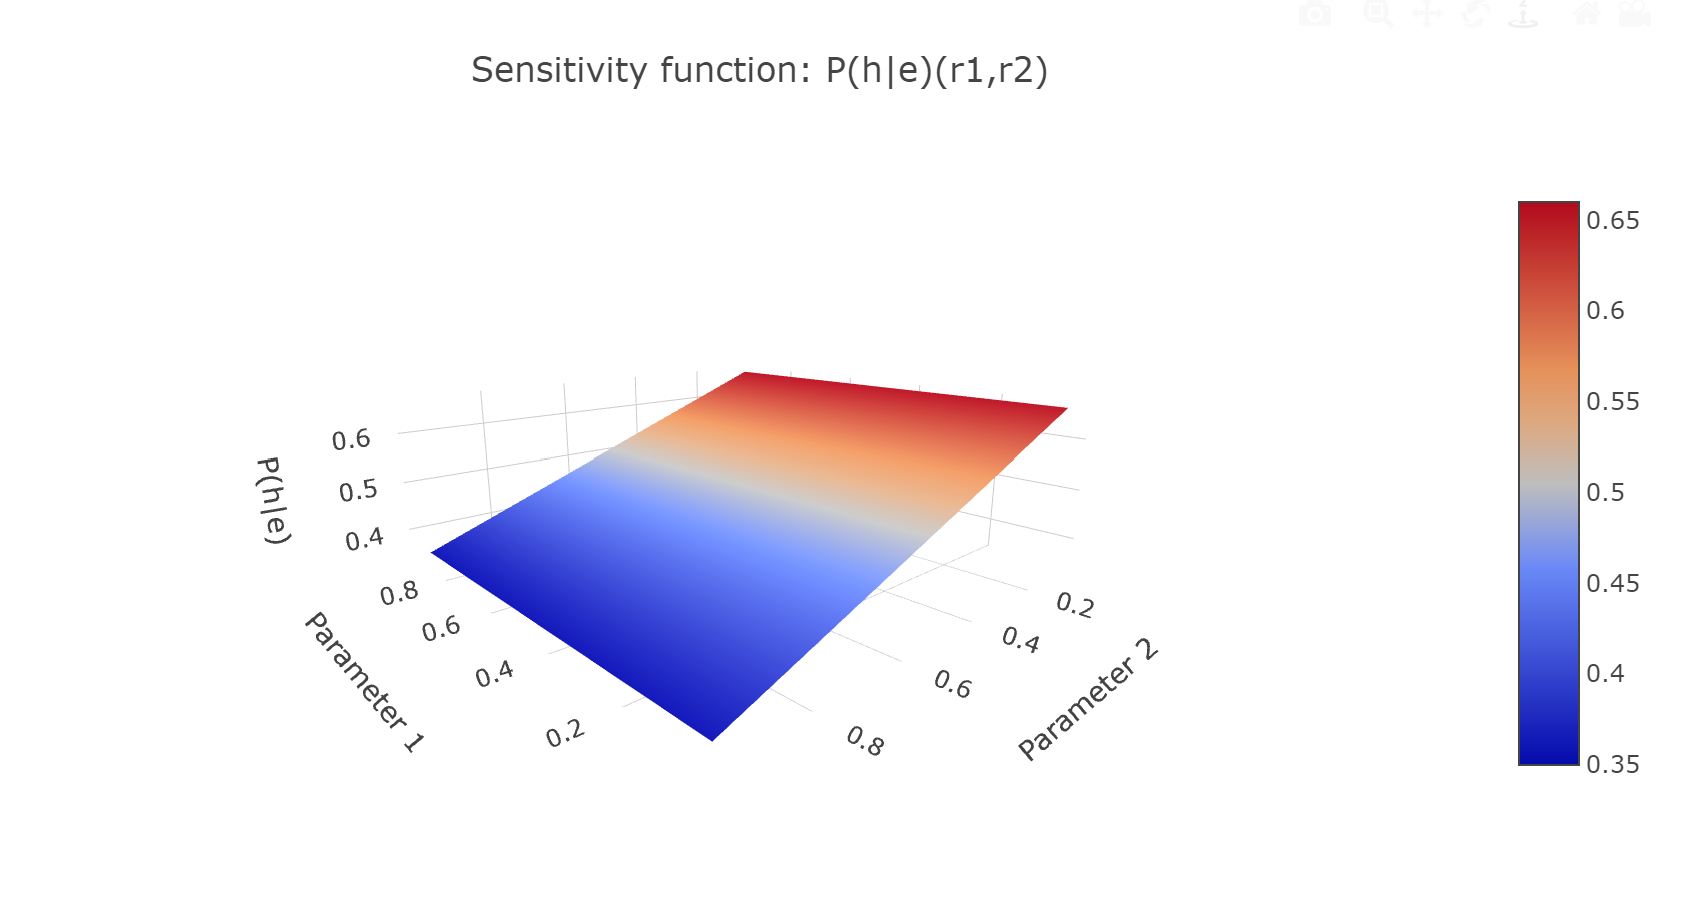
Two way sensitivity to parameters
Two way sensitivity to parameters computes the probability of a hypothesis state given any evidence that may be set P(h|e)), as a function of two parameters of interest.
The result is known as a sensitivity function. Given a sensitivity function, you can pass in a value for each of the parameters and retrieve P(h|e).
A plot of P(h|e) can be generated over a range of both parameter values in order to analyze how sensitive the hypothesis is to the parameters.