Anomaly detection - an introduction
This article describes how to perform anomaly detection using Bayesian networks.
An anomaly detection tutorial using Bayes Server is also available.
We will first describe what anomaly detection is and then introduce both supervised and unsupervised approaches. We will explore the challenges typically encountered with each approach, and then much of what follows will concentrate on unsupervised anomaly detection systems such as those used for condition based maintenance.
NOTE
Here at Bayes Server we have over 15 years' experience building and deploying anomaly detection systems for some of the largest corporations in the world, monitoring their most critical assets.
 {itemprop=image}
NOTE
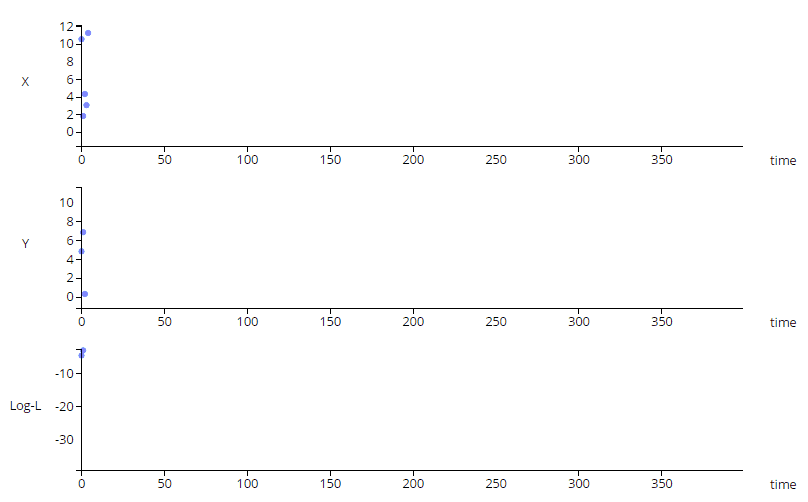
The animation above shows a simple multi-variate unsupervised anomaly detection algorithm in action. The top two charts show
a couple of IOT sensors X & Y evolving over time, while the bottom chart shows the output of a simple anomaly detection model.
Notice that each sensor on its own does not exhibit unusual behavior, but the algorithm can detect an anomalous trend (shown in red), predicting a
potentially catastrophic event.
What is anomaly detection?
Anomaly detection is the process of identifying data which is unusual, and is also known as:
- Outlier detection
- Fault detection
- Novelty detection
- Event detection
- Deviation detection
- Fraud detection
- Data driven health monitoring
- Condition monitoring
- Condition based maintenance
- On condition maintenance
- Health & usage monitoring systems (HUMS)
For example, anomaly detection can be used to give advanced warning of a mechanical component failing (system health monitoring, condition based maintenance), can isolate components in a system which have failed (fault detection), can warn financial institutions of fraudulent transactions (fraud detection), and can detect unusual patterns for use in medical research. It is also often used as a pre-processing step to remove unusual data, before building statistical models.
Anomaly detection can also be used to detect unusual time series. For example, an algorithmic trader may wish to know when a multivariate time series is abnormal, and use that knowledge to gain a competitive advantage.
As well as the use cases listed above, anomaly detection can also be useful whenever you are trying to predict something that does not occur very often (unbalanced data).
NOTE
For example, in advertising technology a click through rate (CTR) is often less than 1%, so is quite rare, and supervised anomaly detection approaches can be useful.
Physics based models
In some settings first principles approaches, such as physics based models can be used to help detect anomalies. For example, in the production of a complex component, tolerances/thresholds may be known from the manufacturing or design process which should not be exceeded. Sometimes a physics based model of the component is built, which can also be used to determine when the component is not behaving as expected.
Data driven models
Data driven models take a different approach, as they use data generated from complex systems/components to build models. The data might be collected from a number of sensors installed on the system, or could be recorded as a result of computerized transactions.
NOTE
You can of course use a combination of both approaches.
Data driven approaches typically have the advantage of being lower cost, can adapt as the system/component evolves (e.g. from corrosion) and can model complex systems/environments where the physics governing the system are not well understood.
Model validation
Even with models that are not designed to perform anomaly detection such as predictive models, anomaly detection can be used to determine whether or not the current model should be trusted given the data that is being used to make predictions.
Put another way, if the data used to make predictions is anomalous, the predictions should not be trusted.
NOTE
Any model used for prediction with Bayes Server can also report the log-likelihood (or with some further analysis the cdf(log-likelihood)) which can indicate whether the data being used for predictions is anomalous.
If a prediction is deemed anomalous, then one approach is to send missing data to any downstream process making use of the prediction.
NOTE
Note that Bayesian networks can work natively with missing data, so any downstream algorithm based on Bayesian networks is still operational.
Components of an anomaly detection system
A successful anomaly detection system is not just about a sophisticated algorithm for detection, but usually requires sophisticated algorithms for prediction (advanced warning, prognostics), diagnostics and automated insight, a robust alerting strategy and accountability procedure, decision automation, a robust reporting framework to keep track of important detection events and cost savings to justify the cost of ownership of the anomaly detections system itself. In addition some systems benefit from planning and scheduling algorithms.
- Detection algorithm - detects anomalies
- Prediction algorithm (prognostics) - predicts / warns of future events/failures
- Diagnostics algorithm - determines what went wrong
- Robust alerting algorithm and notification system - alerts operators/stakeholders
- Accountability / administration of alerts - ensures alerts are not ignored
- Decision automation algorithm - makes decisions based on the state of the system (which is usually uncertain) and costs associated with potential maintenance activities or other interventions
- Planning / scheduling algorithm (in some domains) - optimizes planned maintenance to reduce downtime and therefor cost
- Reporting to justify cost of ownership of anomaly detection system - surfaces key detection events and cost savings to key stakeholders
Supervised anomaly detection
Before we move on to unsupervised anomaly detection, which is the focus of this article, we will briefly describe supervised anomaly detection and some of the associated challenges.
Labeled data
Supervised anomaly detection requires that your data set contains data which is labeled either normal or abnormal (anomalous). Often the label will be either True or False, however the label could be one of a number of fault codes (i.e. has more than one way of failing).
NOTE
When you have multiple fault codes, a discrete variable can be used if the faults are mutually exclusive, or separate variables used for each fault if they can co-occur. If in doubt, imagine how you would record your data in a database table and create a variable for each column.
If you have sufficient anomalous data, supervised anomaly detection can be treated as a classification problem, although care must be taken due to the unbalanced nature of the data.
An example of a supervised anomaly detection system would be one designed for fraud detection, build on a dataset which has a column which indicates whether a particular past transaction was fraudulent or not.
Some limitations of this approach are listed below:
- Often labels are not available
- Anomalies often occur in completely novel ways
- There are often too few anomalous events
- Labeling can be expensive
- Labels may come from another system (e.g. maintenance records) and the data is hard to join up (e.g. to your process data).
- It is too difficult to manually identify anomalous data. Perhaps because the data is high dimensional, or is a complex time series or both
- It is too expensive to label cases manually. E.g. the costs of experts required to categorize the data
NOTE
A key issue above is that anomalies tend to be different in nature each time they occur, and therefore past anomalies do not predict future anomalies well. In practice this is often the case, therefore unsupervised alternatives exist
Unbalanced data
Typically labeled data is unbalanced. This simply means that the unusual/anomalous records are infrequent.
Care must be taken when utilizing accuracy measures. In particular, since your anomalous data is rare, you could potentially achieve an accuracy of 98% even if you predicted all the anomalous data incorrectly.
To avoid this you can make use of a Confusion matrix and use the accuracy measures that are conditional on the anomalous state. Put another way, instead of looking at the overall statistics, you look at the statistics just for the records that are anomalous.
NOTE
This works when the labels are binary (e.g. Anomalous={True, False} or when you have many Faults.
Another useful tool is the Lift chart. By setting the target of the lift chart to the anomalous state, you can see how your model performs on the anomalous data.
Unsupervised anomaly detection
Unsupervised anomaly detection uses a dataset without the requirement for a label to flag each record as normal or abnormal (anomalous). I.e. we use unsupervised techniques.
In this article we focus on unsupervised techniques built from data considered normal. That is the training data set does not contain any data known to be anomalous.
This can be achieved in a number of ways:
Recording periods when the system in question was deemed anomalous, and filtering out the anomalous data prior to model training.
Use the In-sample anomaly detection tool to identify abnormal data from within a training data set, and then filter out the anomalous data prior to model training.
NOTE
You may ask why you can then not just treat this as a classification problem, and the reason is that usually the past anomalous events are too in-frequent, and also that the same events rarely repeat themselves. In fact there may well be no anomalous data at all.
Semi supervised anomaly detection
The term semi supervised is also sometimes used, but can have different meanings.
It is sometimes used to refer to an approach which works on data that contains both normal and anomalous/abnormal data, but has no flag indicating which. A semi supervised algorithm can figure out which is abnormal automatically and build a model of normality from the data. The In-sample anomaly detection tool is an example of an algorithm which can identify abnormal data prior to training.
Is can also mean an algorithm which can work with data that has some records which are labeled/flagged as anomalous. A classification algorithm is then built on the subset of data which is flagged and used to predict whether the remaining data is anomalous or not.
Anomaly detection with Bayesian networks
Bayesian networks are well suited for anomaly detection, because they can handle high dimensional data which humans find difficult to interpret. While some anomalies are clearly visible by plotting individual variables, often anomalies are far more subtle, and are based on the interaction of many variables.
NOTE
Note that mixture models which are often used for anomaly detection, can be represented easily as Bayesian networks, and can be extended to build more complex models.
Bayesian networks also have the following properties, useful for anomaly detection:
- Support for both discrete and continuous variables
- Support for high dimensional models, which humans are bad at interpreting
- Allow missing data (both during learning and prediction/anomaly detection)
- Models can contain data which is not time related, and also time series data, all within the same model
Creating a model
In order to perform anomaly detection with Bayesian networks, the first thing we need is a model. Often an anomaly model is built from data, however there is no reason why experts could not manually specify the parameters for simple models. While there are no restrictions on the structure of Bayesian networks that can be used for anomaly detection, there are differences in how they are built.
Performing anomaly detection
Classification models
If the resulting model is a classification model, in order to perform anomaly detection, we can simply predict which class unseen data belongs to (e.g. normal or anomalous) using standard inference in Bayesian networks. i.e. we set evidence on our Bayesian network, based on the unseen data, and then query the output variable (containing labels normal and anomalous for example). In fact we will get a probability of membership for each label, which tells us how anomalous certain data is.
Log likelihood
If the result of learning is a model that does not contain information about the anomalous data, we have a model which represents normal behavior. We can use this model to see how likely it is that unseen data could have been generated by this model. This tells us how anomalous the unseen data is.
In order to do this, we first set evidence on the Bayesian network according to our unseen data, in the same way as we would using the classification approach. We then calculate the log-likelihood of the evidence entered.
The log-likelihood is simply the log of the probability density function (pdf) for the Bayesian network.
This is just a more complex version of the approach used when calculating the pdf of a Gaussian distribution and then using the pdf to determine how unusual a data point is (e.g. is someone unusually tall).
NOTE
The lower the value of the log-likelihood, the more unusual (anomalous) the data is.
We use the logged value, otherwise we may suffer from underflow, even when using double precision arithmetic, especially in large networks, networks with continuous variables, and networks for time series (Dynamic Bayesian networks).
NOTE
Although the base of the logarithm used is not necessarily important, at Bayes Server we use the natural logarithm. If the Bayesian network contains any exponential distributions (such as Gaussians) they are then in the same form.
An intelligent system can monitor the log likelihood value, in order to oversee the health of components in a system. The value may degrade over time, indicating a potential failure, and is therefore extremely useful in early warning systems. See Image 1 for an example.
Alerting
Alerting is a key component of any anomaly detection system, whether it be to operators / stakeholders or another algorithm.
It is important that alerts surfaced by an anomaly detection system are actionable, either by an operator or another computer.
Both diagnostics and decision automation are important in this regard.
It is diagnostics that guides the operator and maintenance teams. Decision automation can be used to work out the best course of action given the current circumstances and associated costs.
Log likelihood -> probability
The likelihood in this instance is another name for the pdf (probability density function).
Since in general a pdf lies in the interval [0, Infinity), the log-likelihood or log(pdf) lies in the range (-Infinity, 0].
It can be hard to determine whether a particular pdf or log(pdf) value is anomalous. In addition, if a model is retrained
periodically the normal range of log-likelihood values can change, since the model has changed.
To overcome this it can be useful to convert log(pdf) values to probabilities in the range [0,1].
This can be done using the Bayes Server API class BayesServer.Analysis.HistogramDensity.
- First we need some data to create an approximate representation of the log-likelihood distribution. Either:
1 Query log-likelihood values from historic data.
2 Sample data from the Bayesian network using the
BayesServer.Data.Sampling.DataSamplerclass. - Using this data create an instance of the
BayesServer.Analysis.HistogramDensityclass. - When new log-likelihood values need to be converted call the '
BayesServer.Analysis.HistogramDensity.cdffunction.
Alarm fatigue
If a system alerts too frequently, operators will start to ignore future alerts and ultimately stop using the anomaly detection system.
Alarm fatigue is a term that is often used to describe this scenario.
Threshold setting
Although setting a threshold on the probability generated from the cdf(log-likelihood) is not a requirement (instead the value could be fed into another algorithm), they are often used to alert operators. A probability value between 0 and 1 is sometimes converted to a traffic light system. I.e. Green for normal, amber for warning, and red for more series anomalies. The actual values for each threshold can be adjusted as the system evolves to trade off False positives against True negatives.
NOTE
While a traffic light system is useful for operators, it is a simplification that is usually not required by an algorithm that is monitoring the fleet.
Accountability
Once the alerting strategy is robust and False positives are infrequent a strict procedure can be put in place in order to ensure that operators are accountable for ignoring alerts.
Persistence
An alerting strategy should ideally take into account the time the system has been reporting anomalous behavior (persistence), otherwise small deviations from normality (which are quite common) would raise false positives.
Diagnostics
Once an anomaly has been detected / predicted, the next step is to find out what the problem is. This is referred to as diagnostics or troubleshooting.
Bayes Server has a number of features to help with this task.
Retracted log-likelihood
For unsupervised models which report the log-likelihood (indicator of how anomalous the data is), the retracted log-likelihood can be calculated for each variable in the model (such as sensors). For each variable X, this will calculate the log-likelihood as if no evidence was set on X.
NOTE
The retracted log-likelihood can in fact be calculated for pairs of variables or any other combinations of interest.
Retracted analysis
Bayes Server includes a tool called Retracted analysis to aid anomaly detection diagnostics, which helps identify which variable(s) are the root cause.
Retracted evidence
Retracted evidence allows each variable of interest X (e.g. sensors) to show the distribution X would have had, if no evidence was set on X. The retracted distribution is a probability for each state of a discrete variable, or the mean/variance for a continuous variable.
NOTE
Retracted evidence can in fact be calculated for pairs of variables or any other combinations of interest.
Root cause analysis
Due to the graph based nature of Bayesian networks, they are ideal for tracing the root cause(s) (initiating faults/events).
For example if we know that one or more events have been raised by a system, a Bayesian network is able to provide a probability for each possible fault, and even the root cause of cascading faults/events.
Not only can a Bayesian network identify which are the most likely faults, but using a technique called Value of Information, they can inform an operator which components to inspect. In addition a Decision graph can optimize this process when costs are available.
Failure mode, effects, and criticality analysis (FMECA)
Although not covered in this article, Bayesian networks can be used to model the output of a FMECA analysis.
NOTE
We have built networks with thousands of nodes.
FMECA analysis attempts to model risks associated with a complex system/component. Risks that are identified may then be removed by re-design of the system, leaving what are called residual risks (remaining risks). It is these residual risks which can then be mitigated using anomaly detection (often called in service monitoring).
Prediction (Prognostics)
Prediction, or prognostics, is the ability to detect an event in advance.
A P-F curve is sometimes used to illustrate the importance of detecting a future event in advance.
The key points on a P-F curve are as follows:
- The inception of failure (i.e. when the problem started)
- The detection point (when the algorithm first deemed the data to be anomalous)
- The actual point of failure
It is the goal of anomaly detection system to provide the operator with enough time to plan maintenance activities, as opposed to reactive maintenance which is more costly.
Sometimes anomalies happen very fast and advance warning is not possible, however often the log-likelihood (or cdf(log-likelihood)) can be seen to degrade over time, as illustrated at the beginning of the article.
It is often possible for an operator to inspect the log-likelihood trace and do the following:
- Decide whether an intervention can be postponed
- Estimate the remaining life of the component based on the lo-likelihood trend.
When an intervention can be delayed, a more scientific approach would be to build a time series model, using either simple trend forecasting techniques or using a more complex model such as a Dynamic Bayesian network.
Decision automation
As eluded to earlier, Decision graphs which are an extension of standard Bayesian networks allow us to automate the decision making process. Once an anomaly has been found / an event predicted, usually different decisions can be made (interventions), such as which components to fix and when.
The goal is often to reduce downtime and maintain safety standards.
There are usually known costs associated with different actions and these can be modeled using a Decision graph. The model can then automate the decision making process given the relevant costs.
NOTE
Note that costs can be applied to safety aspects such as injury or loss of life (the military often use these approaches).
The important thing to take away about decision graphs is that they make decisions in the face of uncertainty. I.e. due to the uncertainty associated with our belief in the current state of the system, this is not a standard optimization problem. A model can provides us with an estimate of the state of the system, which has uncertainty attached. Decision graphs enable us to optimize costs given this inherent uncertainty.
NOTE
A decision graph can contain multiple decisions nodes and multiple utility nodes (a utility is a negative cost).
Log-likelihood vs residual approaches
Some approaches to anomaly detection build a model and then create a score based on the residuals (e.g. Euclidean distance).
There are a number of reasons why we prefer a robust probabilistic approach listed below.
- Bayesian networks can include both discrete and continuous variables in a statistically sound way
- No scaling of the data is required with Bayesian networks
- Bayesian networks natively handle missing data (both during learning and prediction)
Numerical stability
Bayes Server have invested many years research into the numerical stability of our anomaly detection algorithms.
Much of this research has been spent avoiding underflow (and sometimes overflow) when modeling anomalies.
Given the nature of anomalies, they can have extreme behavior, and it is important to be able to assess the change in anomalous behavior as time evolves for prognostics.
Bayes Server algorithms are designed for anomaly detection and support:
- Models with many variables
- Both discrete and continuous variables
- Time series models
Fleet models
When there are multiple instances of the same components in operation, such as the same engine type fitted to multiple aircraft, or the same compressor installed on multiple units across multiple sites we call this a Fleet.
While it is still useful to model individual components, as they can vary depending on their environment, it us often useful to construct a fleet wide model, built on all the assets in the fleet.
NOTE
In fact a discrete variable can be included in a model with a state for each asset, and the same model used for individual behavior and fleet analysis.
Fleet models are useful because:
- An individual component can be compared against the fleet (see Comparison queries and Automated insight for useful ways of doing this).
- A new asset may not have much data, so can instead take advantage of knowledge from the rest of the fleet initially.
Time series anomaly detection
Anomaly detection is supported with standard Bayesian networks, but also with time series / sequence models, known as Dynamic Bayesian networks (DBNs).
The same approach is used, i.e. using the log-likelihood (or cdf(log_likelihood) ) to detect and monitor for anomalies.
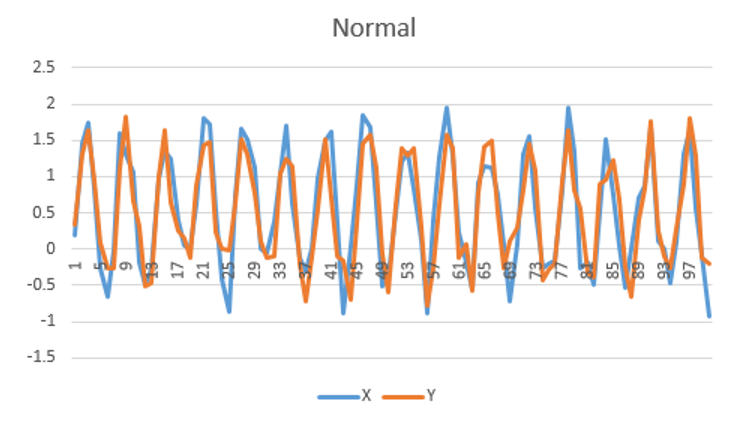
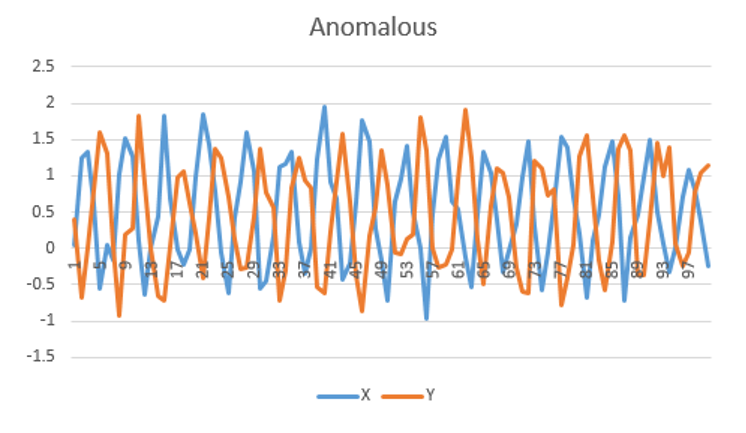
The images below show a simple example of time series anomaly detection, but time series models can be much more complex.
Weighting data
Often more recent data collected from a system/component is more relevant, and older data is no longer representative.
Bayes Server supports the use of Case weights which allows each record to be given a weight which can be any positive numeric value, such as 0.1 for older data or 0.9 for more recent data.
Reporting
An anomaly detection system can often pay for itself for ten years, by detecting a single event that would otherwise have been missed.
However it is important to keep track of detected events and their associated cost savings to justify the cost of ownership, not of the asset being monitored, but of the anomaly detection system itself.
NOTE
Reporting on cost savings or disaster avoidance, is very important to ensure long term success of a deployed anomaly detection system
Adaptation / model maintenance
Data driven anomaly detection models are learned from historic data. Usually the training process is repeated at regular intervals such as each day or each week.
This is important to ensure models stay up to date. In this article we also describe how you can make use of case weights to give more importance to recent data if necessary.
If a system is particular sensitive to recent changes, another approach is to batch learn a model periodically as before, but in between batch learning use Online adaptation.
Expert knowledge
Expert opinion cannot be underestimated when detecting / diagnosing / treating anomalies.
As an example, consider that many diseases are much like an anomaly, where in this case the system under consideration is a person.
It can either be the patient who detects the anomaly (they feel unwell) or it could be surfaced by a regular check-up (routine maintenance).
Experts (in this case doctors, or medical tests) can provide important information that can help determine what the problem is from a set of symptoms (diagnostics).
In some cases they can also help provide an effective treatment (decision support).
Bayesian networks allow expert opinion to be encoded and this can even be mixed with data driven approaches. I.e. some distributions in the network can be specified (elicited) by experts and others learned from data, making Bayesian networks a very powerful paradigm.
Missing data
Bayesian networks natively support missing data. You do not need to fill it in, or remove records (unless a column has a lot of missing data then it might be advisable).
Missing data can be present when training an anomaly detection model and also during the detection, prediction or diagnostics or decision making phases.
NOTE
Data could be missing for many different reasons, such as a faulty sensor, a person did not respond to a question, or a source system was down.
Real-time anomaly detection
Bayes Server models can be deployed and used in off-line or real-time scenarios, or both
Off-line is often used when sensor data is not available in real time from the asset (e.g. an aircraft in flight). Information is downloaded from the asset at regular intervals and then anomaly detection models can be applied to the new (fresh) data.
A real-time scenario would involve a model which is running on the asset itself or on a system which is receiving real-time or near real-time updates from the asset.