Confusion matrix
A Confusion Matrix can be used to evaluate the performance of a model when predicting discrete variables (classification).
NOTE
A classification model is simply a model which is used to predict a discrete variable.
There are cells in the matrix for each combination of actual vs. predicted values. Each cell displays a count, which is the number of times the predicted value matched the actual value.
By changing the Display Value a probability can be displayed instead.
Probability given actual
Probability given actual is the cell count divided by the row count (total number of that actual value in the data).
NOTE
For binary classifiers, the terms recall rate/sensitivity/true positive rate/specificity/true negative rate are sometimes used to refer to particular cells.
Probability given predicted
Probability given predicted is the cell count divided by the column count (total number of that predicted value).
NOTE
For binary classifiers, the terms precision/positive predicted value, are sometimes used to refer to particular cells.
An example confusion matrix is shown below.
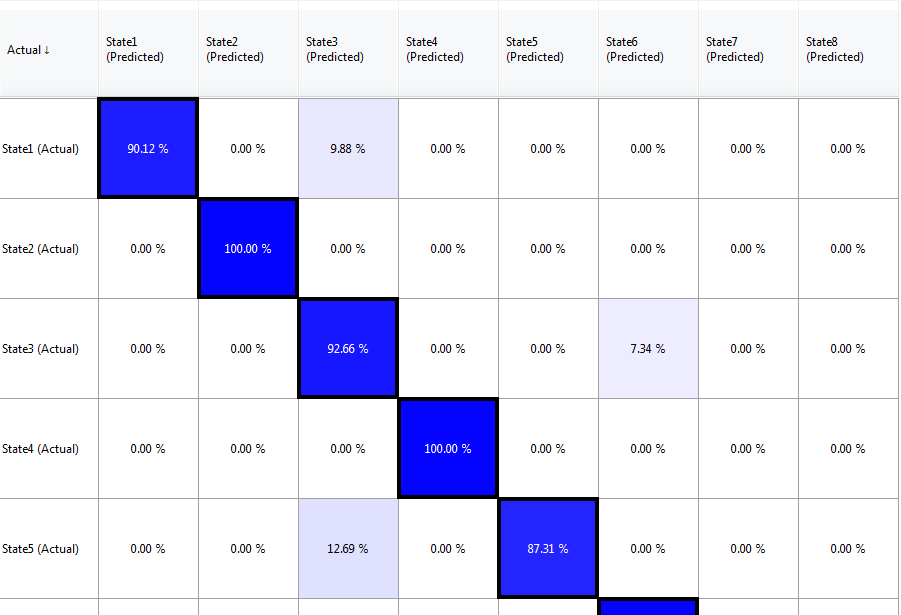
NOTE
The cells that lie on the diagonal from top left to bottom right, represent correct predictions, while off diagonal are incorrect predictions. The diagonal elements are surrounded by a black border for easy identification.
Grid & Error tabs
In addition to the matrix view, you can view a detailed list of all the cell entries on the Grid tab and all but the correct entries on the Errors tab.
The list views are useful as they can be quickly ordered by Count, Probability, Probability | Actual or Probability | Predicted in order to quickly identify potential problems (or successes).
User Interface
A confusion matrix can be generated from the Statistics tab in the Batch Query window.
When using the Data Map to map data to variables in the model, you can either:
Ensure the variable you are predicting is not mapped to data and ensure the actual value is available by adding it as an Information Column in the Data map window.
Leave the mapping between the data and the variable you are predicting, and use retracted evidence so that the prediction does not use the actual value.