Query distribution
The Query Distribution window displays the result of a single query.
For example, when:
- A query is opened from Query explorer.
- A Custom query is executed.
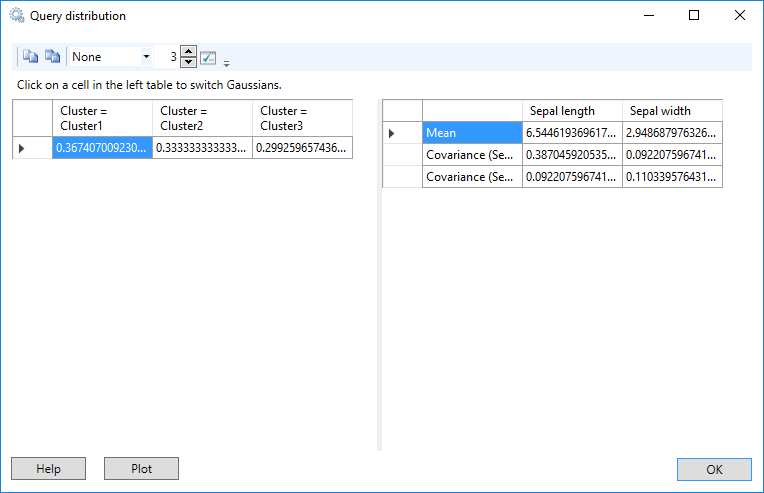
Distribution Values
One or more grids display the values of a distribution. For discrete variables, these values are probabilities. For continuous variables they are the means and variances of the Gaussian distributions.
NOTE
Values can be copied from a read-only grid by selecting the values, and using the keyboard shortcut Ctrl+C. Also, the keyboard shortcut Ctrl+A selects all the values in the current grid.
When a distribution contains both discrete and continuous variables two grids are displayed, one showing the discrete combinations and their probabilities. The other, shows the Gaussian distribution that corresponds to the currently selected discrete combination.
NOTE
Selecting a different cell in the discrete grid, displays the corresponding Gaussian distribution in the continuous grid.
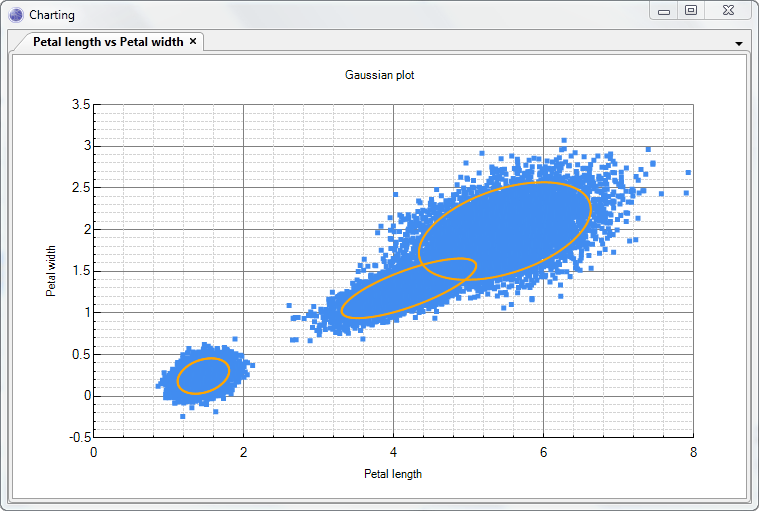
Plot
Distributions that contain continuous variables can be visualized by clicking the Plot button. Data can optionally be included in the resulting chart.
If the option to include data in the resulting chart is chosen, first the Data connection manager will be launched to choose a Data Connection followed by the Data tables and Data map windows in order to select tables, and map variables to columns.