Batch query
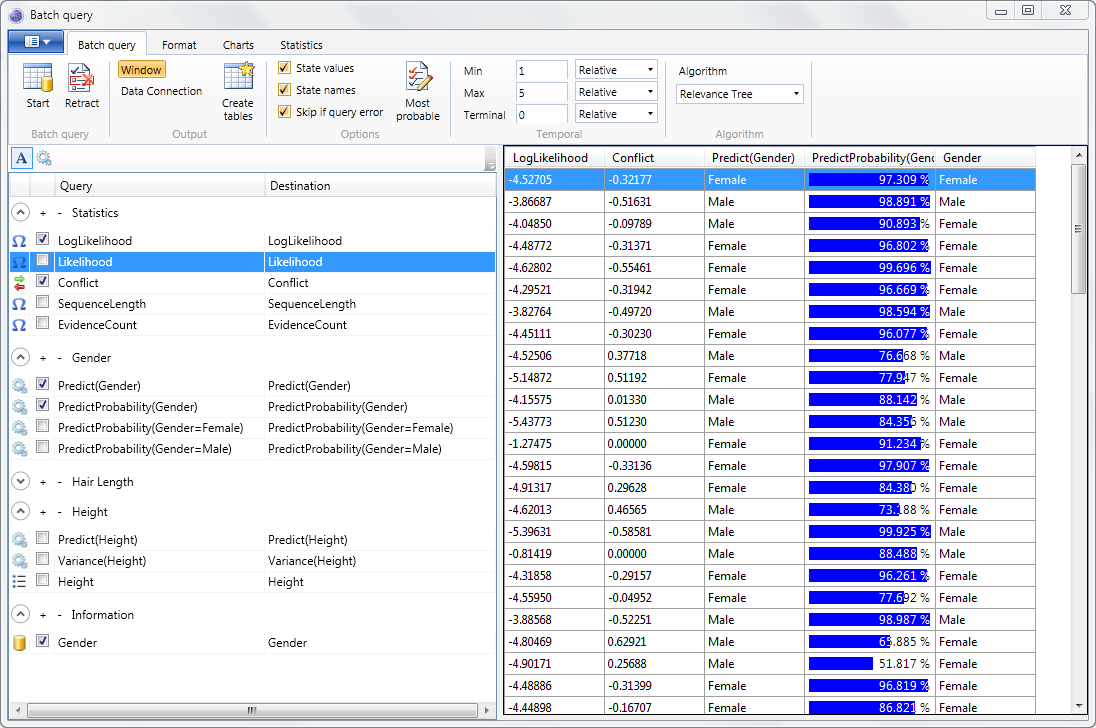
The Batch query window, allows multiple cases to be queried, and output to either the screen or a data source.
The resulting queries can be charted, used to generate summary statistics, used to generate a confusion matrix or lift chart for classification analysis, used to evaluate regression models, evaluate anomaly detection trends and more.
Opening
With a Bayesian network or Dynamic Bayesian network open, click the Batch query button on the main window toolbar tab entitled Data. This will launch the Data tables window. (The batch query window can also be launched by right clicking in the Network viewer, and clicking the Batch query menu, under the Query sub-menu.).
In the Data tables window, select the data you wish to run queries on. This is often a test data set, used to validate your network. For more information about selecting data, see the help for the Data tables window. Once the table or table(s) have been selected, click Ok. This will launch the Data Map window. This window allows you to map data to variables in the network. You can also include additional information only data, on the Information tab of the Data Map window.
NOTE
If you are trying to predict a variable, but have the expected predicted value in the data set, do not map it to the variable. Instead include the data by checking it on the Information tab. This will allow you to perform classification analysis. An alternative to this approach is to use the Retract Evidence feature, which will assume no evidence is present for the variable being predicted.
Clicking Ok on the Data Map window will launch the Batch query window.
Batch queries
To output queries for multiple cases:
- In the Query pane on the left hand side, check the queries you require. (You can also edit the destination column if required.)
- Select either the Window radio button, to output the resulting queries to the current window, or the Data Connection radio button to output to a data source.
- Click the Start button to calculate the batch query.
NOTE
The plus (+) and minus (-) buttons can be used to toggle the queries on and off for a group of queries.
NOTE
How the queries are grouped can be changed using the Query toolbar at the top of the left hand pane. Queries can be grouped by variable or query type.
There are a number of different types of query that can be performed. If you need queries that are not listed, you may need to use the Bayes Server libraries (API). The following list describes each query type.
- LogLikelihood - outputs the log-likelihood for the case.
- Likelihood - outputs the likelihood for the case.
- Conflict - outputs the conflict for the case.
- Sequence length - outputs the maximum time series/sequence time (zero based) for the case.
- Evidence count - outputs the number of variables that have evidence set for the case.
- Predict([Variable]) - outputs the prediction for the [Variable] given the evidence in the case. For discrete variables, this is the most likely state.
- PredictProbability([Variable]) - outputs the probability of the associated prediction for the discrete [Variable] given the evidence in the case, i.e. the probability of the most likely state.
- PredictProbability([Variable]=[State]) - outputs the probability that a discrete [Variable] is in a particular [State] given the evidence in the case.
- PredictVariance([Variable]) - outputs the predicted variance for a continuous [Variable].
- [Variable] - outputs the case evidence for a [Variable].
- [Information] - outputs an information column defined in the Data Map window.
Retract evidence
Consider the prediction of variables X, Y and Z, where all variables have data mapped to them. If the Retract button is checked, then the prediction of X will ignore any evidence set on X, using only evidence set on Y and Z. The prediction of Y will only use evidence set on X and Z, and the prediction of Z will only use evidence set on X and Y. See Retract evidence for more information.
Create tables
Click the Create tables button to create an empty table with columns to accommodate the currently selected predictions.
See the Create tables topic for more information on creating empty tables.
NOTE
In the Query pane you can edit the destination column of a particular query.
State Values
When the State values check box is set to true, the output for any discrete variables with a suitable
BayesServer.StateValueType are the state values, rather than the state name or index.
NOTE
Note that this option overrides the State Names option.
State Names
When the State Names check box is set to true, the output for any discrete variables is the name of the discrete state. When set to false, the output is the zero based index of the state.
NOTE
Note that this option may be overridden by the State Values option.
Skip if query error
This option affects the outcome if an error occurs during the batch query. When true, processing will continue, but cases with errors are not output. A certain number of errors will be displayed at the end of processing. When false, the output stops at the point of the first error encountered.
Most probable explanation
Most probable explanation (MPE), also known as max propagation, computes the most probable configuration of variables that do not have evidence. See Most probable explanation for more information.
Temporal options
Allow the minimum and maximum times to be set, when running batch time series queries on networks with temporal nodes (i.e. dynamic Bayesian networks).
Algorithm
This option determines the algorithm used, when calculating the batch query.
Format
The Display format group, allows the formatting of numeric values output to the window. This does not affect the output to data sources. See Numeric format for more information.
The Output format group, allows the replacement of Infinite values. This is useful for databases such as Microsoft Sql Server, that do not support infinite values in their floating point data types.
Charts
The chart tab, allows visualization of batch queries, when output to the window.
The plot button requires columns to be selected in the X and Y drop downs. The Color drop down is optional, allowing points to be colored based on the values in a column.
If the Selected check box is true, only the currently selected cases are plot.
The Histogram button, creates either a histogram of discrete data or continuous data (using bins). For more information see Histogram.
The Temporal group, allows temporal (time series) predictions/data to be plot. To create a temporal plot, click the Plot button in the Temporal group, which will launch a window allowing the selection of a number of temporal data columns to plot.
The Temporal histogram button, creates either a discrete or continuous histogram of temporal data. For more information see Histogram.
If the Selected cases check box is true, only the currently selected cases are plot.
NOTE
The Selected cases option filters the plot to the cases selected in the top pane, not selected items in the bottom pane.
The legend checkbox, when true, adds a legend to the temporal chart for each case. This is only suitable for a moderate number of cases.
Statistics
The Statistics tab on the main toolbar, contains functionality to calculate aggregate statistics, and perform classification or regression analysis.
The Summary button displays simple aggregate statistics from the batch queries, such as counts and mean values. Support is included for temporal and non temporal data.
The Confusion matrix button displays a confusion matrix for discrete predictions. Both a predicted discrete value, and the expected value are required to use this feature. The expected value, can be included in the output, via an Information Column, defined in the Data map window.
NOTE
An alternative way of accessing the expected value, is to map the predicted variable in the Data map window, and use retracted evidence so that the prediction does not use the expected value.
The Lift chart creates a chart that can be used to evaluate the performance of a classification model. For more information see Lift chart.
The Regression statistics button calculates aggregate statistics about the prediction of a continuous variable compared to its expected value. The expected value, can be included in the output, via an Information Column, defined in the Data map window.
NOTE
An alternative way of accessing the expected value, is to map the predicted variable in the Data map window, and use retracted evidence so that the prediction does not use the expected value.