Mesh query
Introduction
The mesh query tool, can generate 2-D or 3-D surface plots by repeatedly querying a network, while varying the value of 2 variables which are plot on the X and Y axes.
The X and Y variables can be discrete or continuous. Also, temporal (time series) variables are supported.
A mesh (grid) of values is generated for each combination of X and Y, and a statistic such as the likelihood/log likelihood or the value of a third variable, is used for the Z axis.
The Z axis can be:
- A statistic such as Likelihood, Log-Likelihood etc...
- The probability of a discrete variable state
- The mean of a continuous variable
- The result of a function node
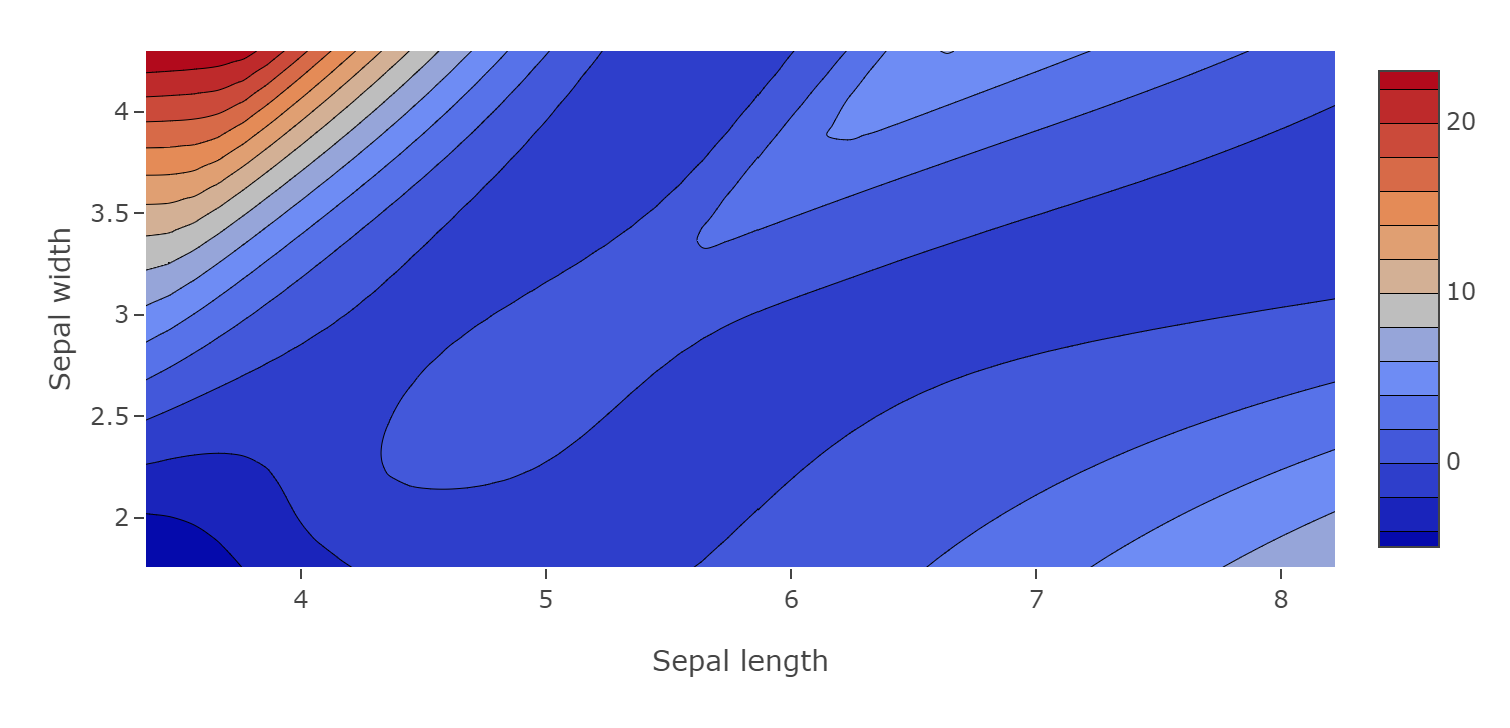
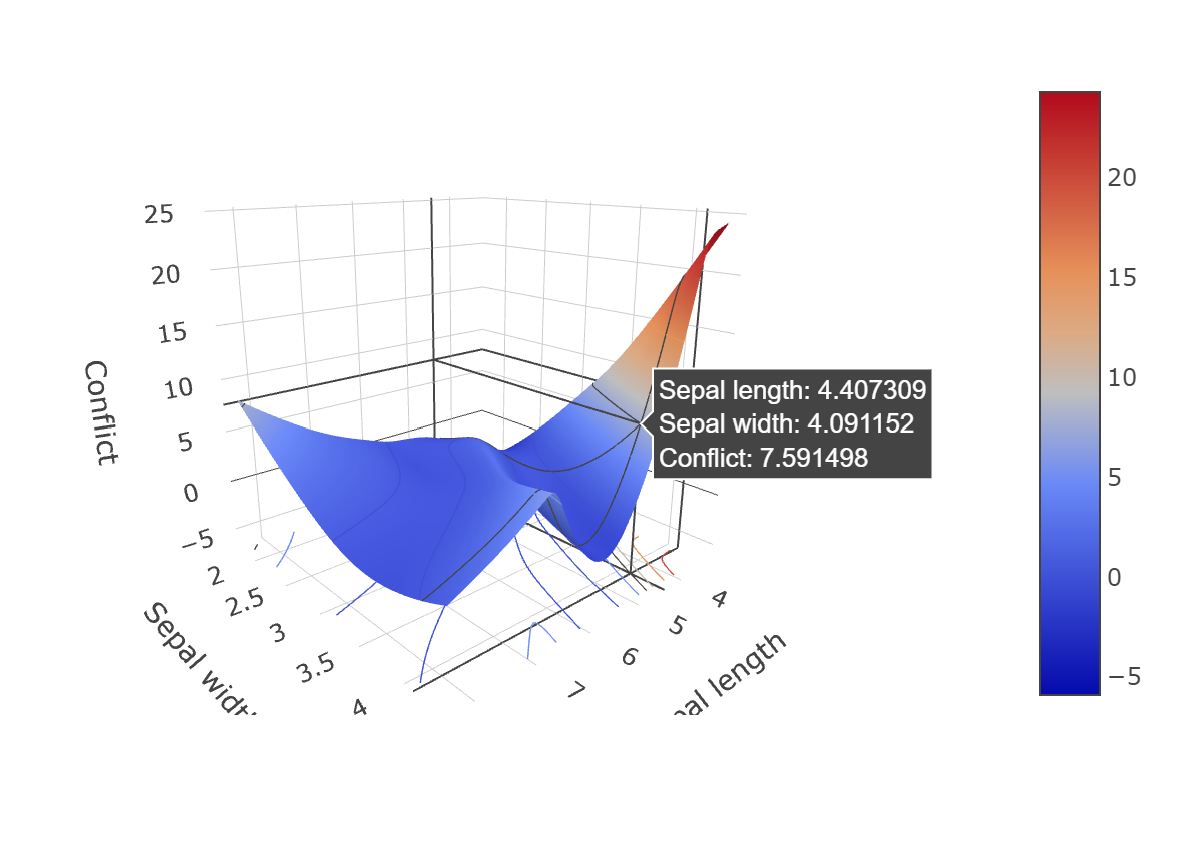
Example outputs are shown below.
When a continuous variable is selected for the Z axis, the predicted mean value is plot. When a discrete variable is selected, the maximum predicted probability from all states is plot, and when a discrete variable state is selected, the predicted probability for that particular state is plot.
Current evidence
When checked, any evidence currently set on the network, is used in the calculations.