Data sampling
Data Sampling is the process of generating data from a Bayesian network or Dynamic Bayesian network. Some uses for Data Sampling are:
- Generating data to understand and visualize a network.
- Generating test data.
- Understanding how the log-likelihood varies.
Opening
With a Bayesian network or Dynamic Bayesian network open, click the Data Sampling button on the main window toolbar tab entitled Data.
Data Sampling
To generate sample data:
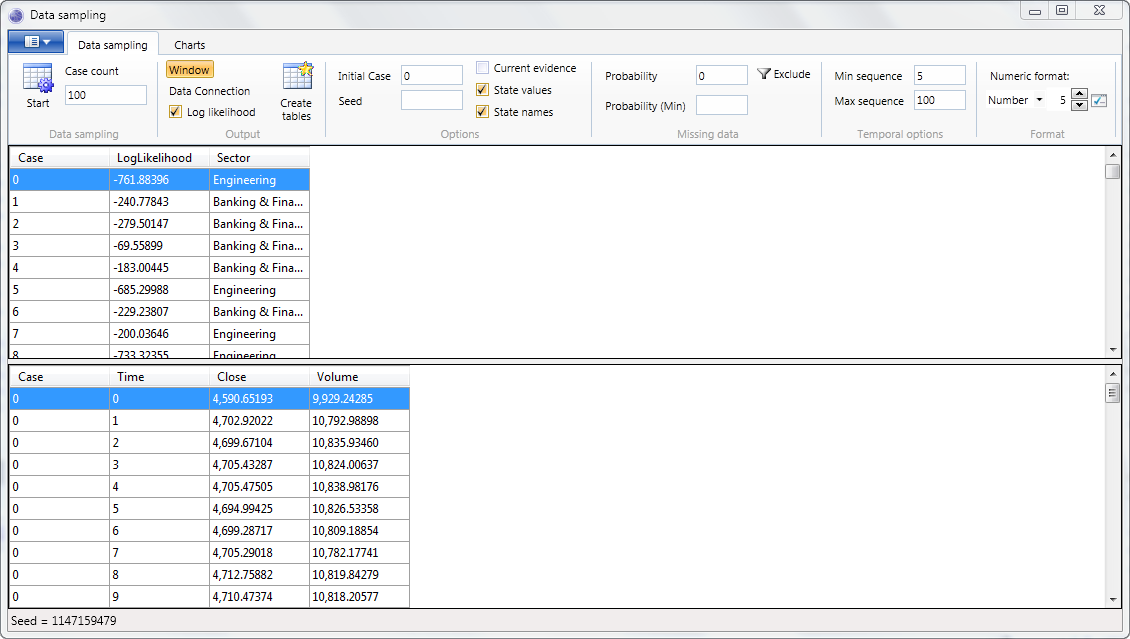
- Select either the Window radio button, to output the sampled data to the current window, or the Data Connection radio button to output to a data source.
- Click Run to start the data sampling.
NOTE
If the Data Connection option is selected, first the Data connection manager will be launched to choose a Data Connection followed by the Data tables and Data map windows in order to select output tables, and map variables to columns.
Create tables
See the Create tables topic for more information on creating empty tables.
NOTE
When the Log Likelihood checkbox is checked, a log likelihood column will be created.
Log Likelihood
When the Log Likelihood checkbox is checked, an additional column is added to the sampled data, which reports the Log likelihood of the generated sample.
NOTE
When evidence is fixed, each case has an associated weight that can be output if necessary. The log-likelihood output however is unweighted. i.e. it reflects the log-likelihood of the case as if it had a weight of 1.
NOTE
When sampled data is output to the window, columns can be sorted by clicking the header in the data grid. It can be useful to sort by Log Likelihood to see the range of values generated.
Sample Count
The Sample Count text box specifies how many cases to generate.
NOTE
When sampling from networks with temporal variables (i.e. Dynamic Bayesian networks) the sample count does not equal the number of sequence rows generated, but rather the number of cases generated, each of which will have its own sequence.
Initial case
An initial case value can be specified in the Initial Case textbox to generate case identifiers starting from values other than zero. This is useful for appending to existing data.
Seed
A non negative seed value can be specified in the Seed textbox to initialize the random number generator used by the data sampling algorithm.
State Values
When the State values check box is set to true, the output for any discrete variables with a suitable
BayesServer.StateValueType are the state values, rather than the state name or index.
NOTE
Note that this option overrides the State Names option.
State Names
When the State Names check box is set to true, the output for any discrete variables is the name of the discrete state. When set to false, the output is the zero based index of the state.
NOTE
Note that this option may be overridden by the State Values option.
Weight / Log(weight)
Bayes Server supports sampling data when certain evidence is fixed. When evidence is fixed, each sample has an associated weight, which is the likelihood of the fixed evidence for the current sample. This indicates how likely it is that the fixed evidence could have occurred with this sample.
To output the weight, ensure the Weight check box or the Log Weight check box is checked.
NOTE
Log weight is useful when the likelihood of the fixed evidence can be very small, such as when sampling from time series and sequences. The log weight is simply log(weight) however is calculated in such a way that it does not suffer from underflow problems.
Current Evidence
When the Current Evidence check box is checked, any evidence currently entered in the current Bayesian network or Dynamic Bayesian network will be used in the data sampling process.
Missing Data
By specifying a value between 0 and 1 (inclusive), in the missing data Probability text box, a proportion of values will be randomly set to missing (null/unobserved). Optionally an additional minimum probability can be specified in the Probability (Min) text box. When set, the missing data probability for each case varies randomly between the two specified probabilities.
NOTE
The missing data mechanism used is Missing Completely At Random (MCAR).§
To exclude certain variables from having missing data, click the Filter button in the Missing Data toolbar group. This will launch a window allowing the selection of variables to be excluded.
Temporal options
The Min Sequence and Max Sequence text boxes specify inclusive lower and upper bounds on the length or sequences generated for temporal variables.
NOTE
To generate sequences of all the same length, set Min Sequence equal to Max Sequence.
Format
The Numeric Format control, changes the formatting applied to displayed numeric types. It does not affect data output to a data source, such as a database or spreadsheet. See Numeric format for more information.
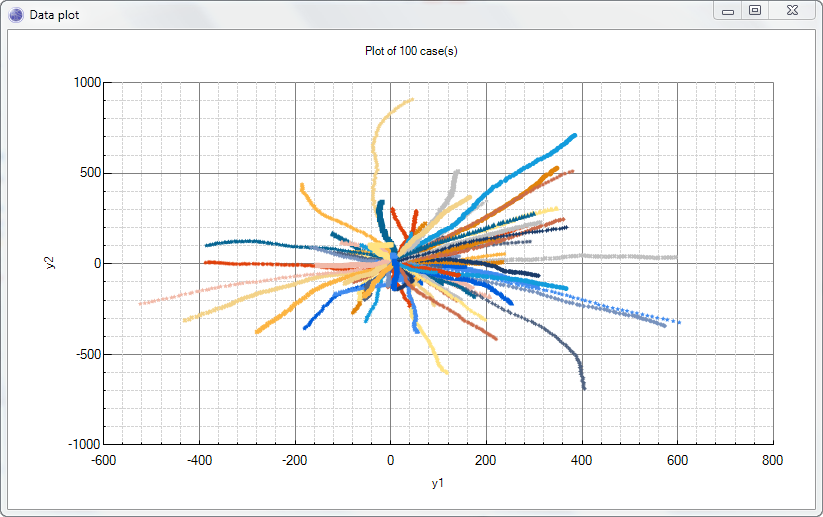
Charting
The Charts tab, allows data sampled from Bayesian networks and Dynamic Bayesian networks to be charted. This is useful to visualize a network, in order to understand how it behaves.
NOTE
Charting uses data output to the current window only.
To create a chart of non temporal data, use the Charts toolbar group. First select the variables to plot in the X and Y and/or Y2 drop downs, and then click the Plot button.
The Selected option restricts the plot to the cases selected.
NOTE
Zooming can be performed by dragging the mouse to select a region of the chart.
The Histogram button plots either a discrete or continuous histogram of the data. See Histogram for more information.
To create a chart of temporal data, use the Temporal Charts toolbar group. First select the variables to plot in the X and Y and/or Y2 drop downs, and then click the Plot button, or one of its drop down items to plot using a specific chart type.
The Legend option, when checked displays the case id for each sequence plotted. This is useful to discriminate between different time series/sequences.
The Selected option restricts the plot to the cases selected in the top data grid.
The Temporal Histogram button plots either a discrete or continuous histogram of temporal data. See Histogram for more information.