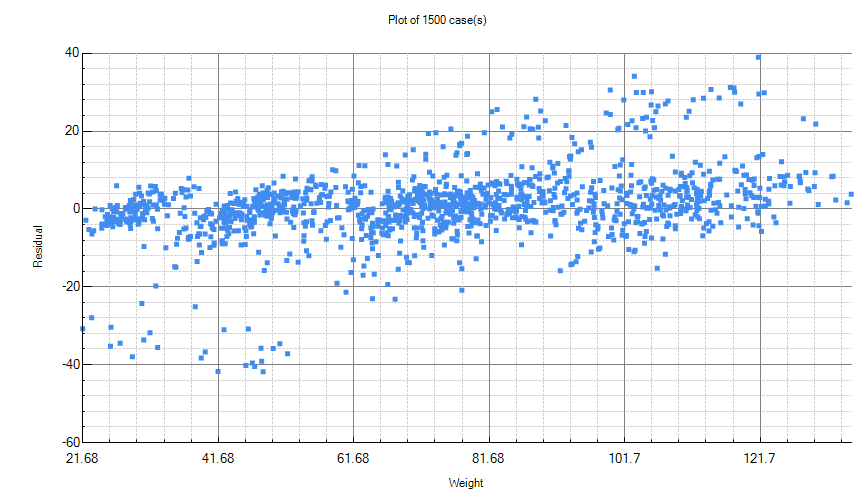
Residual plot
Residual plots are useful to analyze the output of regression models.
NOTE
In Bayes Server a model is called a regression model if the variable you are trying to predict is continuous.
A residual is the difference between the actual value and the predicted value. For example if a customer was 39 years old in your database, and you built a model to predict age, which returned 39.5 the residual would be 39 - 39.5 = -0.5.
If you plot residuals you can sometimes see patterns that might indicate poor performance, highlighting potential problems with your model.
NOTE
Residuals should be evenly distributed above and below 0.
Creating residual plots
Residual plots can be created from a Batch query when you have predicted a continuous variable.
Once a Batch query has been performed, click the Residuals button on the Statistics tab of the Batch Query main toolbar.