Distribution editor
Each node in a Bayesian network requires a probability distribution to be specified, conditioned on its parent nodes.
So for a node A, with parents B,C the distribution to be specified is
P(A|B,C).
NOTE
Distributions are made up from variables, not nodes. If nodes contain single variables, then nodes are equivalent to variables.
However, if nodes contain multiple variables, then the distribution required contains the variables in the node, conditioned on
the variables in the parent nodes. In the example above, if node A contained the variables {A1,A2},
B contained {B1,B2} and C contained just {C1} then the distribution required
for node A would be P(A1,A2|B1,B2,C1).
Creating new distributions
If a node does not have a distribution assigned, click the New button to create one.
Editing distributions
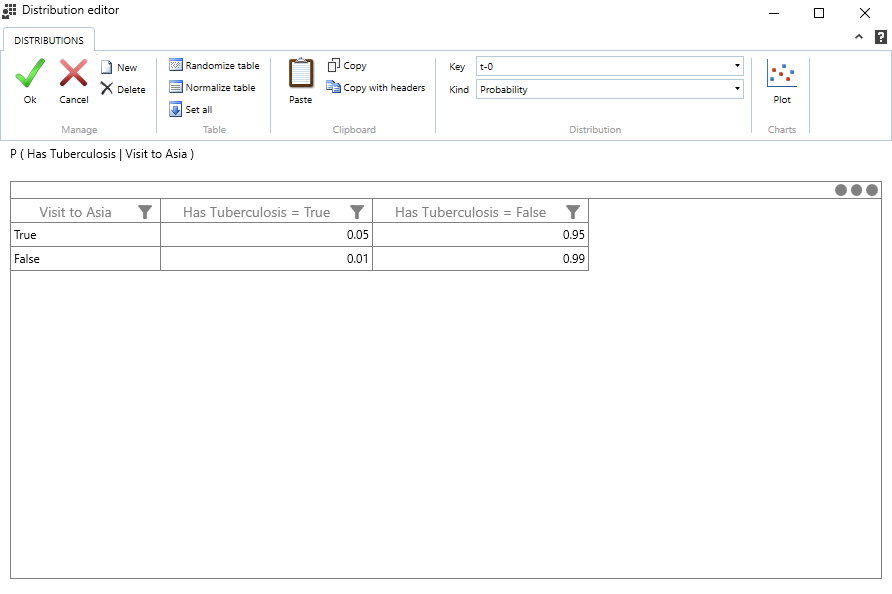
Once a distribution has been created for a node, numeric values can be entered in the grid(s) to define the distribution.
For nodes with discrete variables, enter probability values, such that each parent combination sums to 1 (i.e. is stochastic). Counts/frequencies can also be entered, and then normalized to probability values by clicking the Normalize button. Random values can be assigned, ensuring the values are stochastic, by clicking the Randomize button.
For continuous distributions, enter means/intercepts, covariances, and weights (regression coefficients).
Deleting Distributions
If a node has a distribution assigned, the Delete button removes it, leaving a null distribution.
Continuous Distributions
Continuous distributions in Bayes Server are represented by Conditional Linear Gaussian (CLG) distributions.
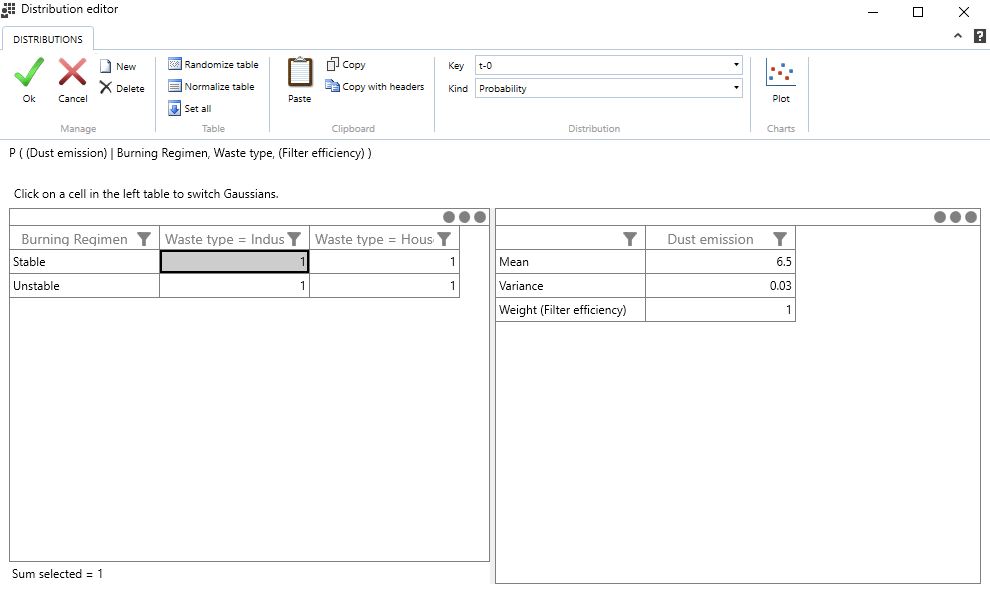
If a continuous node has any discrete parents, then the probability table on the left allows selection of the Gaussian distribution that corresponds to the discrete combination selected.
Temporal Distributions
Temporal nodes in a Dynamic Bayesian network, can have multiple distributions, that correspond to different times.
Each distribution can be selected by changing the Time drop down.
V-Order
Version 10 or later
You can change the order in which parameters are displayed/edited.
NOTE
This can be used in conjunction with re-ordering columns
For example, you might want to display/edit variables A, B and C in this order:
| A | B | C = False | C = True |
|---|---|---|---|
| False | False | 0.7 | 0.3 |
| False | True | 0.1 | 0.9 |
| True | False | 0.25 | 0.75 |
| True | True | 0.8 | 0.2 |
Alternatively, you might want to display/edit the same distribution in this order:
| A | C | B = False | B = True |
|---|---|---|---|
| False | False | 0.7 | 0.1 |
| False | True | 0.3 | 0.9 |
| True | False | 0.25 | 0.8 |
| True | True | 0.75 | 0.2 |
NOTE
Being able to change the V-Order is particularly useful when you want to copy and paste from another distribution or another application that represents variables in a different way.
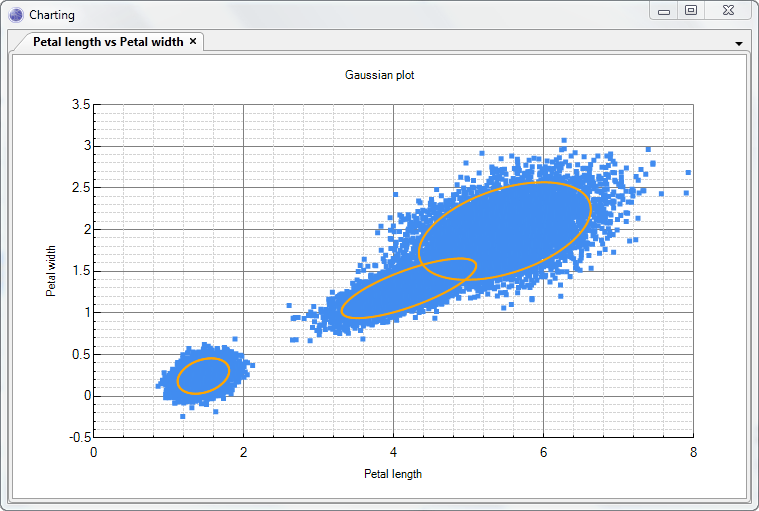
Plot
Version 9.0 or earlier
A chart of continuous distributions can be generated by clicking the Plot button. This allows visualization of Gaussians and Mixtures of Gaussians, and also allows data to be added to the charts.
NOTE
Zooming can be performed by dragging the mouse to select a region of the chart.