Data explorer
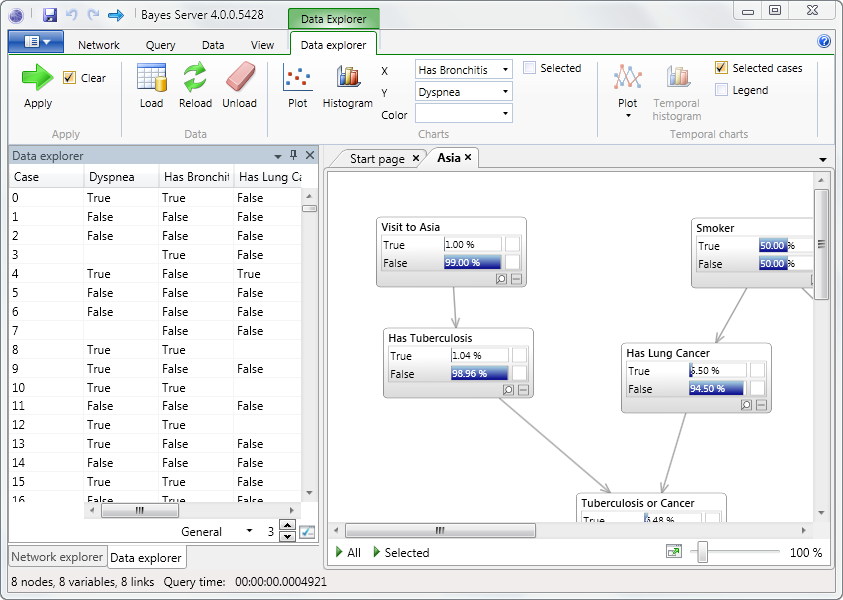
Data explorer provides a read only view of data stored in a variety of data sources, and allows data to be mapped to variables in a Bayesian network or Dynamic Bayesian network, in order to set evidence.
This allows the use of familiar databases or spreadsheets to manage evidence data, and provides an easy mechanism to load different sets of evidence into a Bayesian network or Dynamic Bayesian network quickly.
NOTE
Data explorer loads data into memory, so large data sets are not supported. This does not exclude large data sets from being used elsewhere in Bayes Server (e.g. Parameter Learning supports large data sets).
Apply evidence
Apply, sets evidence on the relevant Bayesian network or Dynamic Bayesian network, based on the mappings between Variables and Data columns, defined on Load.
To apply evidence, select a row of data and then either click on the Apply button in the contextual ribbon tab entitled Data Explorer or right click in Data Explorer and click Apply. A row of data can also be double clicked.
The Clear check box determines whether all evidence is cleared, when evidence is applied. When True,
all evidence is cleared first, irrespective of whether a variable is mapped to data.
Load data
To load data into Data Explorer, a Bayesian network or Dynamic Bayesian network must be open. Then either click on the Load button in the contextual ribbon tab entitled Data Explorer or right click in Data Explorer and click Load.
This will launch the Data Tables window followed by the Data Map window allowing data to be selected and then mapped to Variables.
Reload data
Reload is useful if data has been edited in the underlying data source, and a refresh is required.
To reload data in Data Explorer either click on the Reload button in the contextual ribbon tab entitled Data Explorer or right click in Data Explorer and click Reload.
Unload data
Unload removes all data from Data Explorer.
To unload data in Data Explorer either click on the Unload button in the contextual ribbon tab entitled Data Explorer or right click in Data Explorer and click Unload.
Charts
Simple charts of non temporal data can be generated by selecting the Database columns to plot using the X and Y drop downs, followed by the Plot button in the Charts group.
The Selected check box determines whether only the currently selected cases in Data Explorer are plotted. When False, all cases are plotted.
NOTE
Zooming can be performed by dragging the mouse to select a region of the chart.
The Histogram button plots either a discrete or continuous histogram of the data. See Histogram for more information.
Temporal Charts
Charts of temporal data can be generated by clicking the Plot button in the Temporal charts group.
The Selected check box determines whether only the currently selected cases in Data Explorer are plotted. When False, all cases are plotted.
When the Legend check box is True, temporal plots include a legend which identifies the Case Id of each time Series/sequence.
The Temporal Histogram button plots either a discrete or continuous histogram of temporal data. See Histogram for more information.
Numeric Format
The format of numeric data can be changed using the Numeric Format control, located at the bottom of Data explorer. See Numeric format for more information.